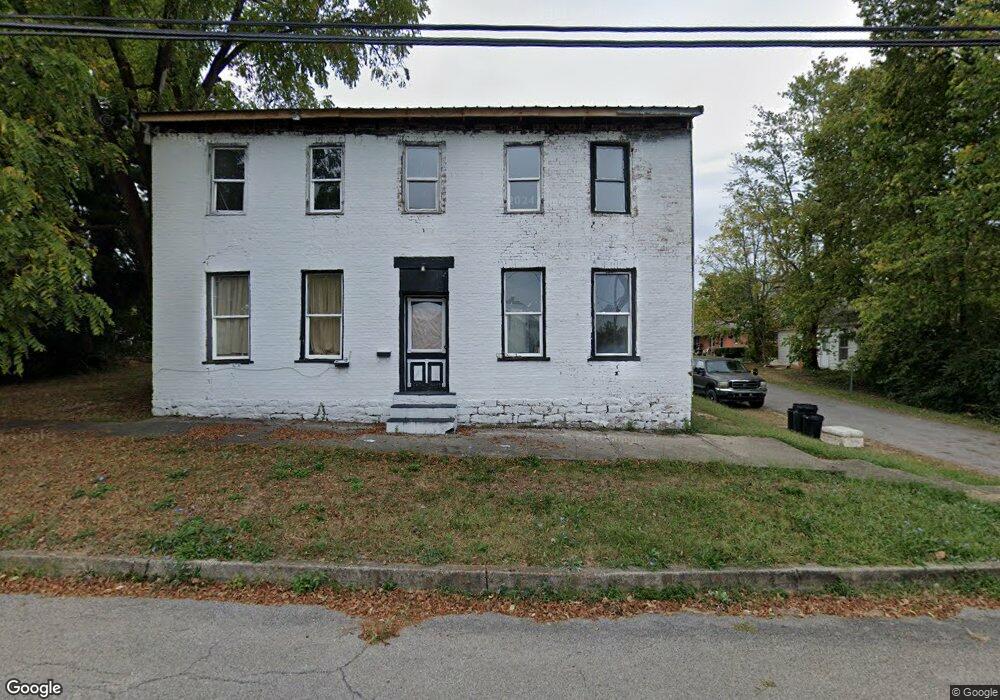
311 S Apple St Georgetown, OH 45121
Estimated Value: $86,000 - $217,000
4
Beds
3
Baths
2,304
Sq Ft
$70/Sq Ft
Est. Value
About This Home
This home is located at 311 S Apple St, Georgetown, OH 45121 and is currently estimated at $160,722, approximately $69 per square foot. 311 S Apple St is a home with nearby schools including Georgetown Elementary School and Georgetown Jr/Sr High School.
Ownership History
Date
Name
Owned For
Owner Type
Purchase Details
Closed on
Sep 5, 2006
Sold by
Green Tree Servicing Llc
Bought by
Sheperd Grover
Current Estimated Value
Purchase Details
Closed on
Apr 30, 2004
Sold by
Swinson Denny M and Swinson Ginny L
Bought by
Bank One Na and First National Bank Of Chicago
Purchase Details
Closed on
Apr 20, 2004
Sold by
Bank One Na
Bought by
Sheperd Grove
Purchase Details
Closed on
Dec 31, 1997
Sold by
Jones Joan B
Bought by
Swinson Dennis M
Home Financials for this Owner
Home Financials are based on the most recent Mortgage that was taken out on this home.
Original Mortgage
$20,970
Interest Rate
7.28%
Mortgage Type
Commercial
Create a Home Valuation Report for This Property
The Home Valuation Report is an in-depth analysis detailing your home's value as well as a comparison with similar homes in the area
Home Values in the Area
Average Home Value in this Area
Purchase History
| Date | Buyer | Sale Price | Title Company |
|---|---|---|---|
| Sheperd Grover | $30,000 | None Available | |
| Bank One Na | $23,333 | -- | |
| Sheperd Grove | $21,400 | Resource Title Agency Inc | |
| Swinson Dennis M | $69,900 | -- |
Source: Public Records
Mortgage History
| Date | Status | Borrower | Loan Amount |
|---|---|---|---|
| Previous Owner | Swinson Dennis M | $20,970 |
Source: Public Records
Tax History Compared to Growth
Tax History
| Year | Tax Paid | Tax Assessment Tax Assessment Total Assessment is a certain percentage of the fair market value that is determined by local assessors to be the total taxable value of land and additions on the property. | Land | Improvement |
|---|---|---|---|---|
| 2024 | $103 | $2,830 | $2,830 | $0 |
| 2023 | $94 | $2,390 | $2,390 | $0 |
| 2022 | $94 | $2,390 | $2,390 | $0 |
| 2021 | $93 | $2,390 | $2,390 | $0 |
| 2020 | $83 | $1,990 | $1,990 | $0 |
| 2019 | $544 | $13,220 | $1,990 | $11,230 |
| 2018 | $541 | $13,220 | $1,990 | $11,230 |
| 2017 | $432 | $12,470 | $1,750 | $10,720 |
| 2016 | $432 | $12,470 | $1,750 | $10,720 |
| 2015 | $450 | $12,470 | $1,750 | $10,720 |
| 2014 | $450 | $12,310 | $1,590 | $10,720 |
| 2013 | $449 | $12,310 | $1,590 | $10,720 |
Source: Public Records
Map
Nearby Homes