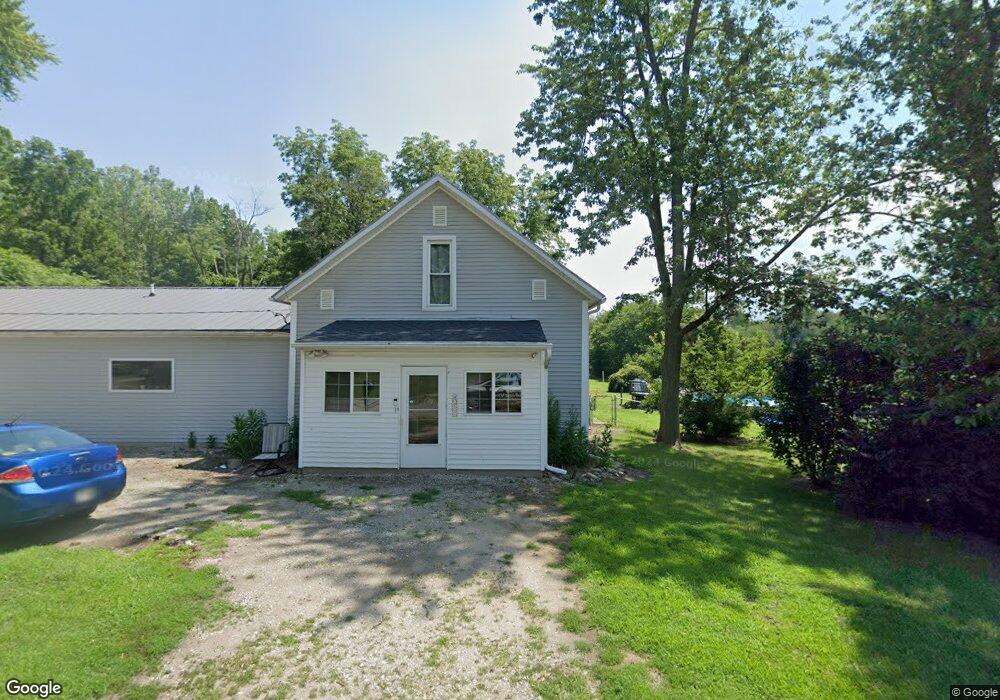
311 S Liberty St West Unity, OH 43570
Estimated Value: $177,000 - $190,000
3
Beds
1
Bath
1,560
Sq Ft
$119/Sq Ft
Est. Value
About This Home
This home is located at 311 S Liberty St, West Unity, OH 43570 and is currently estimated at $184,956, approximately $118 per square foot. 311 S Liberty St is a home located in Williams County with nearby schools including Hilltop Elementary School and Hilltop High School.
Ownership History
Date
Name
Owned For
Owner Type
Purchase Details
Closed on
Sep 28, 2006
Sold by
Citimortgage Inc
Bought by
Borton Eric L and Borton Bobbi J
Current Estimated Value
Home Financials for this Owner
Home Financials are based on the most recent Mortgage that was taken out on this home.
Original Mortgage
$24,900
Interest Rate
6.5%
Mortgage Type
Future Advance Clause Open End Mortgage
Purchase Details
Closed on
Jun 19, 2006
Sold by
Clark Carol A
Bought by
Citifinancial Mortgage Company Inc
Purchase Details
Closed on
Mar 15, 2001
Sold by
Russell Frederick F and Russell Pamela P
Bought by
Clark Carol A
Purchase Details
Closed on
Aug 14, 2000
Sold by
Russell Edwards C and Russell O
Bought by
Russell Frederick F and Russell Pamela P
Purchase Details
Closed on
Jan 1, 1990
Bought by
Russell Edwards C and Russell O
Create a Home Valuation Report for This Property
The Home Valuation Report is an in-depth analysis detailing your home's value as well as a comparison with similar homes in the area
Purchase History
| Date | Buyer | Sale Price | Title Company |
|---|---|---|---|
| Borton Eric L | $24,900 | None Available | |
| Citifinancial Mortgage Company Inc | $24,667 | None Available | |
| Clark Carol A | $45,000 | -- | |
| Russell Frederick F | $20,000 | -- | |
| Russell Edwards C | -- | -- |
Source: Public Records
Mortgage History
| Date | Status | Borrower | Loan Amount |
|---|---|---|---|
| Closed | Borton Eric L | $24,900 |
Source: Public Records
Tax History
| Year | Tax Paid | Tax Assessment Tax Assessment Total Assessment is a certain percentage of the fair market value that is determined by local assessors to be the total taxable value of land and additions on the property. | Land | Improvement |
|---|---|---|---|---|
| 2025 | $2,043 | $50,330 | $13,090 | $37,240 |
| 2024 | $2,043 | $50,330 | $13,090 | $37,240 |
| 2023 | $1,849 | $40,040 | $11,620 | $28,420 |
| 2022 | $1,954 | $40,040 | $11,620 | $28,420 |
| 2021 | $1,954 | $40,040 | $11,620 | $28,420 |
| 2020 | $1,730 | $34,230 | $9,940 | $24,290 |
| 2019 | $1,705 | $34,230 | $9,940 | $24,290 |
| 2018 | $862 | $34,230 | $9,940 | $24,290 |
| 2017 | $1,446 | $28,770 | $7,630 | $21,140 |
| 2016 | $928 | $19,320 | $7,630 | $11,690 |
| 2015 | $1,066 | $19,320 | $7,630 | $11,690 |
| 2014 | $1,066 | $20,340 | $8,020 | $12,320 |
| 2013 | $1,031 | $20,030 | $8,020 | $12,010 |
Source: Public Records
Map
Nearby Homes
- 000 W Jackson
- 611 W Jackson St
- 613 W Jackson St
- 902 E Church St
- 502 N Lincoln St
- 22227 Us Highway 20a
- 9019 19-50 Rd
- 8437 18 Rd
- 8520 County Road 16
- 8520 Williams County Road 16
- 301 Horton St
- 303 E Curtis St
- 14640 U S 20a
- 200 Tyler Ln
- 302 Tyler Ln
- 16299 County Road F75
- 10918 Ohio 15
- 0 St Rt 15 Unit 10001011
- 21672 County Road J
- 0 US Highway 20a
- 314 S Liberty St
- 312 S Liberty St
- 11435 20-40 Rd (Aka South Liberty St)
- 310 S Liberty St
- 308 S Liberty St
- 307 S Liberty St
- 313 S Main St
- 304 S Liberty St
- 217 S Liberty St
- 309 S Main St
- 315 S Main St
- 20 S Liberty County Road 20- 40
- 307 S Main St
- 302 Liberty Ln
- 302 S Liberty St
- 323 S Main St
- 325 S Main St
- 305 S Main St
- 214 S Liberty St
- 215 S Liberty St
Your Personal Tour Guide
Ask me questions while you tour the home.