$155,000
SOLD DEC 21, 2018

311 S Muller Pkwy Bloomington, IN 47403

7 Beds
3 Baths
2,664 Sq Ft
0.26 Acres

Recently Sold

$58 Per Sq Ft

16% Below List Price

21 Days on Market

Highlights

  • Forced Air Heating and Cooling System
  • Level Lot
  • 1-Story Property
  • Tri-North Middle School Rated A
  • Carpet

About This Home

As of April 2023

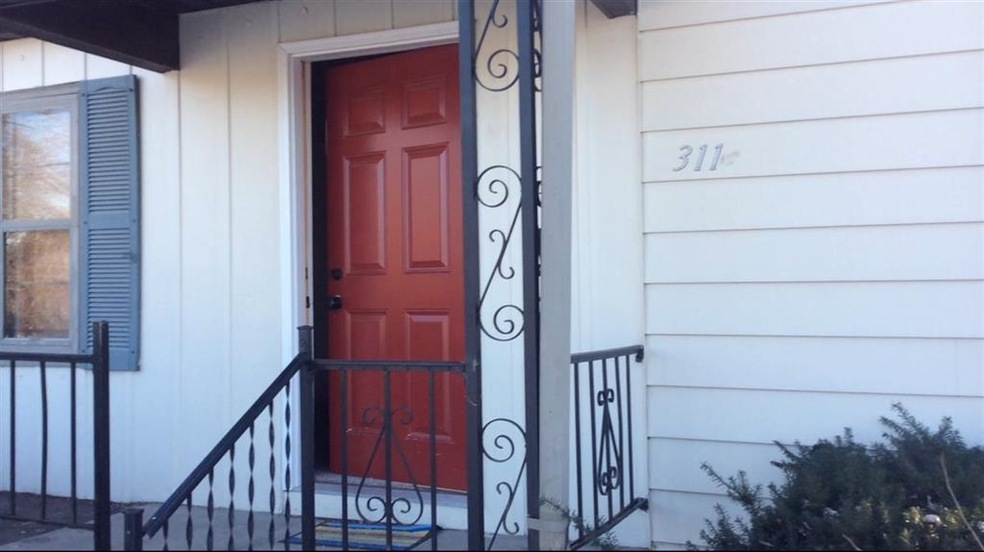
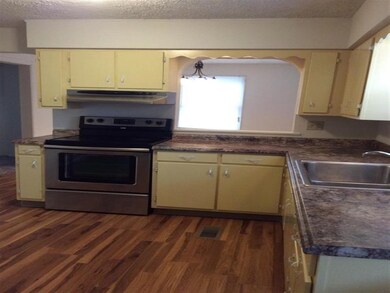
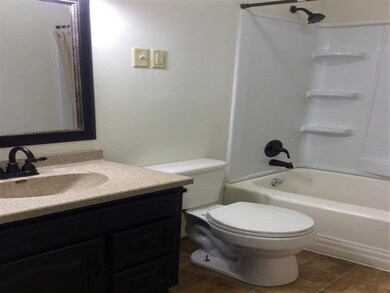
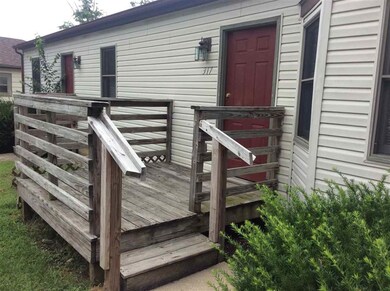
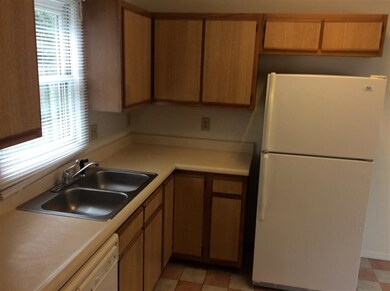
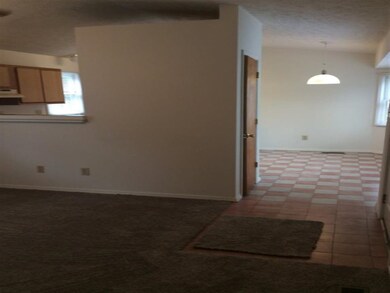
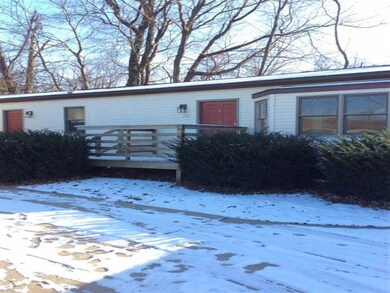
This is your opportunity to own 3 single family home rentals on one parcel. 311 S Muller Pkwy home is the largest at 1200 SF with 3 bedrooms and 1 bath. It is currently rented at $900/month (lease ends 3/1/19). 317 & 321 S Muller Parkway have 720 SF, 2 Bedrooms and 1 bath and rent for $650/month each. 317 S Muller Parkway lease ends on 8/30/19 and 321 S Muller Parkway lease ends on 3/13/19.

Property Details

Home Type

  • Multi-Family

Year Built

  • Built in 1952

Lot Details

  • 0.26 Acre Lot
  • Level Lot

Parking

  • 5 Parking Spaces

Interior Spaces

  • 1-Story Property
  • Partially Finished Basement
  • Crawl Space
  • Laminate Countertops

Flooring

  • Carpet
  • Vinyl

Bedrooms and Bathrooms

  • 7 Bedrooms
  • 3 Full Bathrooms

Utilities

  • Forced Air Heating and Cooling System
  • Heating System Uses Gas
  • Gas Water Heater

Community Details

  • 3 Buildings
  • 3 Units

Listing and Financial Details

  • Tenant pays for electric, heating
  • The owner pays for lawn maintenance, tax
  • Assessor Parcel Number 53-08-06-100-051.000-009

Property Details

Home Type

Multi-Family

Year Built

Built in 1952

Lot Details

0

Listing Details

  • Class: INVESTMENT
  • Year Built: 1952
  • Age: 66
  • Style: One Story
  • Bedrooms: 7
  • Number Above Grade Bedrooms: 7
  • Total Bathrooms: 3
  • Total Full Bathrooms: 3
  • Legal Description: 015-65330-00 Seminary Pt Lot 182; .24A &.02A |
  • Parcel Number ID: 53-08-06-100-051.000-009
  • Platted: Yes
  • Amenities: Countertops-Laminate, Deck Open, Water Heater Gas
  • Sp Lp Percent: 83.78
  • Monthly Gross Income: 2200
  • Special Features: None
  • Property Sub Type: MultiFamily

Interior Features

  • Total Sq Ft: 3533
  • Total Finished Sq Ft: 2664
  • Above Grade Finished Sq Ft: 2664
  • Below Grade Sq Ft: 869
  • Price Per Sq Ft: 58.18
  • Basement: Yes
  • Basement Foundation: Crawl, Partial Basement
  • Flooring: Carpet, Vinyl
  • Total Below Grade Sq Ft: 869
  • Number Of Ranges Ovens: 3

Exterior Features

  • Exterior: Aluminum
  • Stories: 1

Garage/Parking

  • Number Of Parking Spaces: 5

Utilities

  • Cooling: Central Air
  • Heating Fuel: Gas, Forced Air
  • Sewer: City
  • Water Utilities: City
  • Number Of W D Hookups: 1

Schools

  • School District: Monroe County Community School Corp.
  • Elementary School: Fairview
  • Middle School: Tri-North
  • High School: Bloomington North

Lot Info

  • Lot Description: Level
  • Lot Dimensions: .2600
  • Estimated Lot Sq Ft: 11326
  • Estimated Lot Size Acres: 0.26

Rental Info

  • Lease Term: 1 Year
  • Owner Pays: Lawn Maintenance, Tax
  • Tenant Pays: Electric, Heating

Multi Family

  • Gross Monthly Rent: 2200
  • Number Of Dishwashers: 2
  • Number Of Dryers: 2
  • Number Of Refrigerators: 3
  • Number Of Units: 3
  • Number Of Washers: 2
  • Num Of2 Bedrooms: 2
  • Number Of 3 Bedrooms: 1
  • Num Of Units Rented: 3

Tax Info

  • Annual Property Tax: 5203

Ownership History

Date Name Owned For Owner Type

Purchase Details

Listed on
Jan 14, 2022
Closed on
Apr 19, 2023
Sold by
Jsa Investments Llc
Bought by
Jlbs Property Llc
Seller's Agent
Autumn McCoy
The Real McCoy Realty
Buyer's Agent
Autumn McCoy
The Real McCoy Realty
List Price
$299,000
Sold Price
$285,000
Premium/Discount to List
-$14,000
-4.68%
Total Days on Market
21
Views
281
Current Estimated Value
$427,656

Home Financials for this Owner

Home Financials are based on the most recent Mortgage that was taken out on this home.
Estimated Appreciation
$142,656
Avg. Annual Appreciation
21.10%

Purchase Details

Listed on
Oct 31, 2018
Closed on
Dec 21, 2018
Sold by
Duncan Brandon J
Bought by
Jsa Investments Llc
List Price
$185,000
Sold Price
$155,000
Premium/Discount to List
-$30,000
-16.22%

Home Financials for this Owner

Home Financials are based on the most recent Mortgage that was taken out on this home.
Avg. Annual Appreciation
15.10%
Source: Public Records

Range of Values:

Collateral Analytics

Collateral Analytics Collateral Analytics AVMs (Automated Valuation Model) employ a number of statistical approaches combined with neighborhood-specific comparable selection guarantees the most up-to-date and precise valuations.

Not Available

Collateral Analytics does not have data for the current month. Please view the chart for historical values.

ICE

ICE Mortgage Technology ICE Mortgage Technology’s AVM (Automated Valuation Model) is a state-of-the-art online residential property valuation tool that provides a quick and accurate estimate of the value of almost any home in the U.S.

Not Available

ICE Mortgage Technology does not have data for the current month. Please view the chart for historical values.

First American

First American First American Data & Analytics’ next-generation AVM combines unrivaled data assets with a blended ensemble of valuation models to produce highly accurate, reliable valuations you can trust.

Not Available

First American does not have data for the current month. Please view the chart for historical values.

Quantarium

Quantarium Quantarium’s valuation service, repeatedly proven the industry’s most accurate and comprehensive, is supercharged with a self-learning and auto-tuning AI engine that continually becomes smarter and more accurate as it processes daily inputs from the industry’s leading RE data lake.

Not Available

Quantarium does not have data for the current month. Please view the chart for historical values.

Average Value
Not Available
List Price
Sold Price
Create a Home Valuation Report for This Property
The Home Valuation Report is an in-depth analysis detailing your home's value as well as a comparison with similar homes in the area

Home Values in the Area

Source: Public Records

Average Home Value in this Area


Source: Public Records

Purchase History

Date Type Sale Price Title Company
Deed $285,000 John Bethel Title Company
Warranty Deed -- None Available
Source: Public Records

Property History

Date Event Price Change Sq Ft Price
03/06/2025 03/06/25 Off Market $1,700 -- --
02/25/2025 02/25/25 Price Changed $1,700 -27.7% $1 / Sq Ft
01/30/2025 01/30/25 For Rent $2,350 0.0% --
01/09/2025 01/09/25 For Rent $2,350 0.0% --
12/29/2024 12/29/24 Off Market $2,350 -- --
10/03/2024 10/03/24 For Rent $2,350 0.0% --
04/21/2023 04/21/23 Sold $285,000 -4.7% $107 / Sq Ft
01/22/2023 01/22/23 For Sale $299,000 0.0% $112 / Sq Ft
01/22/2023 01/22/23 Price Changed $299,000 +4.9% $112 / Sq Ft
01/14/2023 01/14/23 Off Market $285,000 -- --
01/14/2022 01/14/22 For Sale $324,900 +109.6% $122 / Sq Ft
12/21/2018 12/21/18 Sold $155,000 -16.2% $58 / Sq Ft
11/21/2018 11/21/18 Pending -- -- --
10/31/2018 10/31/18 For Sale $185,000 0.0% $69 / Sq Ft
02/22/2018 02/22/18 Rented $900 +5.9% --
02/22/2018 02/22/18 Under Contract -- -- --
01/15/2018 01/15/18 For Rent $850 -- --
Source: Indiana Regional MLS

Tax History Compared to Growth

Source: Public Records

Tax History

Year Tax Paid Tax Assessment Tax Assessment Total Assessment is a certain percentage of the fair market value that is determined by local assessors to be the total taxable value of land and additions on the property. Land Improvement
2024 $2,573 $266,800 $109,200 $157,600
2023 $2,573 $243,200 $100,100 $143,100
2022 $4,426 $218,600 $87,100 $131,500
2021 $3,905 $188,400 $79,400 $109,000
2020 $3,954 $191,300 $71,700 $119,600
2019 $3,575 $170,000 $43,500 $126,500
2018 $5,343 $254,600 $33,300 $221,300
2017 $5,203 $248,200 $33,300 $214,900
2016 $3,670 $250,100 $33,300 $216,800
2014 $3,729 $251,700 $33,300 $218,400
Source: Public Records

Agents Affiliated with this Home

  • Section Image
See All Agents

Map

Source: Indiana Regional MLS

MLS Number: 201848765

Indiana Regional MLS

APN: 53-08-06-100-051.000-009