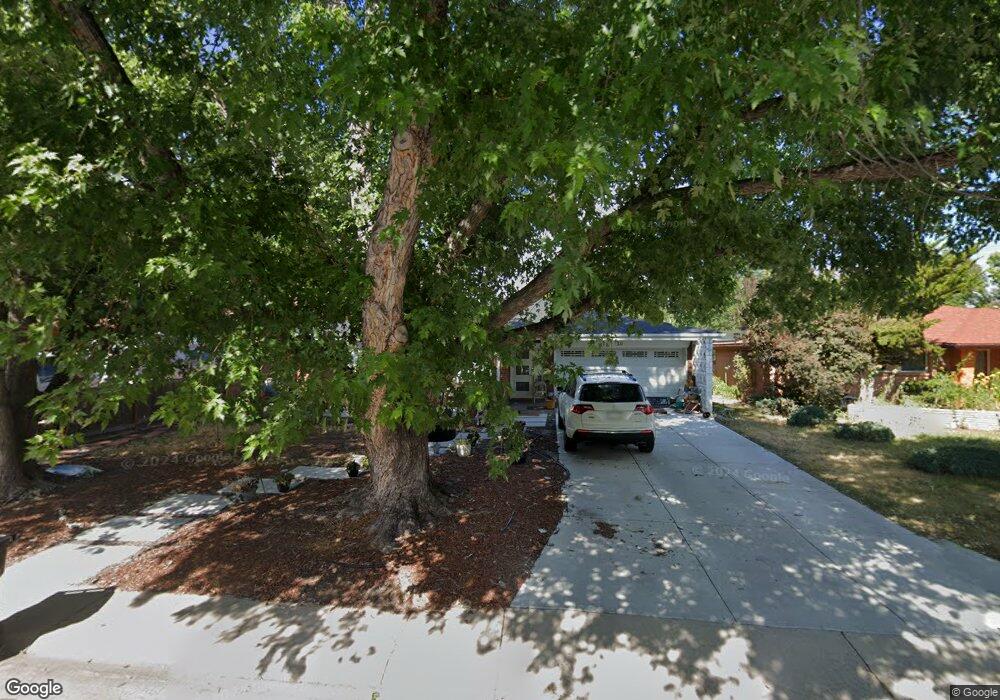
311 S Niagara St Denver, CO 80224
Washington Virginia Vale NeighborhoodEstimated Value: $726,000 - $900,000
3
Beds
3
Baths
2,104
Sq Ft
$381/Sq Ft
Est. Value
About This Home
This home is located at 311 S Niagara St, Denver, CO 80224 and is currently estimated at $801,671, approximately $381 per square foot. 311 S Niagara St is a home located in Denver County with nearby schools including Denver Green School, George Washington High School, and Stanley British Primary School.
Ownership History
Date
Name
Owned For
Owner Type
Purchase Details
Closed on
Oct 27, 2017
Sold by
Rosenfld Neil D
Bought by
Rosenfeld Neil D and Rosenfeld Nina B
Current Estimated Value
Home Financials for this Owner
Home Financials are based on the most recent Mortgage that was taken out on this home.
Original Mortgage
$35,000
Outstanding Balance
$29,406
Interest Rate
3.86%
Estimated Equity
$772,265
Purchase Details
Closed on
Dec 7, 2016
Sold by
Rosenfeld Neil D and Rosenfeld Frances
Bought by
Rosenfeld Neil D
Purchase Details
Closed on
Oct 29, 2004
Sold by
Burrington Robert R and Smythe Shawn
Bought by
Rosenfeld Neil D and Rosenfeld Frances
Home Financials for this Owner
Home Financials are based on the most recent Mortgage that was taken out on this home.
Original Mortgage
$71,700
Outstanding Balance
$36,228
Interest Rate
5.66%
Mortgage Type
Purchase Money Mortgage
Estimated Equity
$765,443
Purchase Details
Closed on
Oct 10, 2001
Sold by
Burrington Robert R and Smythe Kimberly Shawn
Bought by
Burrington Robert R and Smythe Shawn
Home Financials for this Owner
Home Financials are based on the most recent Mortgage that was taken out on this home.
Original Mortgage
$187,000
Interest Rate
6.85%
Purchase Details
Closed on
Nov 12, 1998
Sold by
Burrington Robert R
Bought by
Burrington Robert R and Smythe Kimberly Shawn
Create a Home Valuation Report for This Property
The Home Valuation Report is an in-depth analysis detailing your home's value as well as a comparison with similar homes in the area
Home Values in the Area
Average Home Value in this Area
Purchase History
| Date | Buyer | Sale Price | Title Company |
|---|---|---|---|
| Rosenfeld Neil D | -- | None Available | |
| Rosenfeld Neil D | -- | None Available | |
| Rosenfeld Neil D | $270,000 | Security Title | |
| Burrington Robert R | -- | -- | |
| Burrington Robert R | -- | -- |
Source: Public Records
Mortgage History
| Date | Status | Borrower | Loan Amount |
|---|---|---|---|
| Open | Rosenfeld Neil | $35,000 | |
| Open | Rosenfeld Neil D | $71,700 | |
| Previous Owner | Burrington Robert R | $187,000 |
Source: Public Records
Tax History Compared to Growth
Tax History
| Year | Tax Paid | Tax Assessment Tax Assessment Total Assessment is a certain percentage of the fair market value that is determined by local assessors to be the total taxable value of land and additions on the property. | Land | Improvement |
|---|---|---|---|---|
| 2024 | $3,977 | $50,210 | $23,070 | $27,140 |
| 2023 | $3,891 | $50,210 | $23,070 | $27,140 |
| 2022 | $3,011 | $37,860 | $22,210 | $15,650 |
| 2021 | $3,011 | $38,940 | $22,840 | $16,100 |
| 2020 | $2,851 | $38,430 | $14,280 | $24,150 |
| 2019 | $2,771 | $38,430 | $14,280 | $24,150 |
| 2018 | $2,752 | $35,570 | $14,380 | $21,190 |
| 2017 | $2,744 | $35,570 | $14,380 | $21,190 |
| 2016 | $2,819 | $34,570 | $11,446 | $23,124 |
| 2015 | $2,701 | $34,570 | $11,446 | $23,124 |
| 2014 | $2,283 | $27,490 | $9,043 | $18,447 |
Source: Public Records
Map
Nearby Homes
- 404 S Oneida Way
- 308 S Locust St
- 6524 E Alaska Dr
- 222 S Olive St
- 435 S Olive Way
- 441 S Monaco Pkwy
- 434 S Newport Way
- 6435 E Cedar Ave
- 188 S Locust St
- 7055 E Virginia Ave
- 360 S Krameria St
- 507 S Pontiac Way
- 488 S Leyden St
- 43 S Oneida Ct
- 6758 E Lowry Blvd
- 405 S Krameria St
- 6959 E Lowry Blvd
- 10 Oneida Ct
- 18 Oneida Ct
- 260 S Jasmine St
- 303 S Niagara St
- 323 S Niagara St
- 6650 E Alameda Ave
- 333 S Niagara St
- 314 S Niagara St
- 304 S Niagara St
- 324 S Niagara St
- 343 S Niagara St
- 306 S Magnolia St
- 312 S Magnolia St
- 302 S Magnolia St
- 334 S Niagara St
- 316 S Magnolia St
- 315 S Newport Way
- 322 S Magnolia St
- 344 S Niagara St
- 305 S Newport Way
- 325 S Newport Way
- 6675 E Nevada Place
- 335 S Newport Way