311 S Viola St Duncan, OK 73533
Estimated Value: $51,000 - $69,000
2
Beds
1
Bath
1,121
Sq Ft
$53/Sq Ft
Est. Value
About This Home
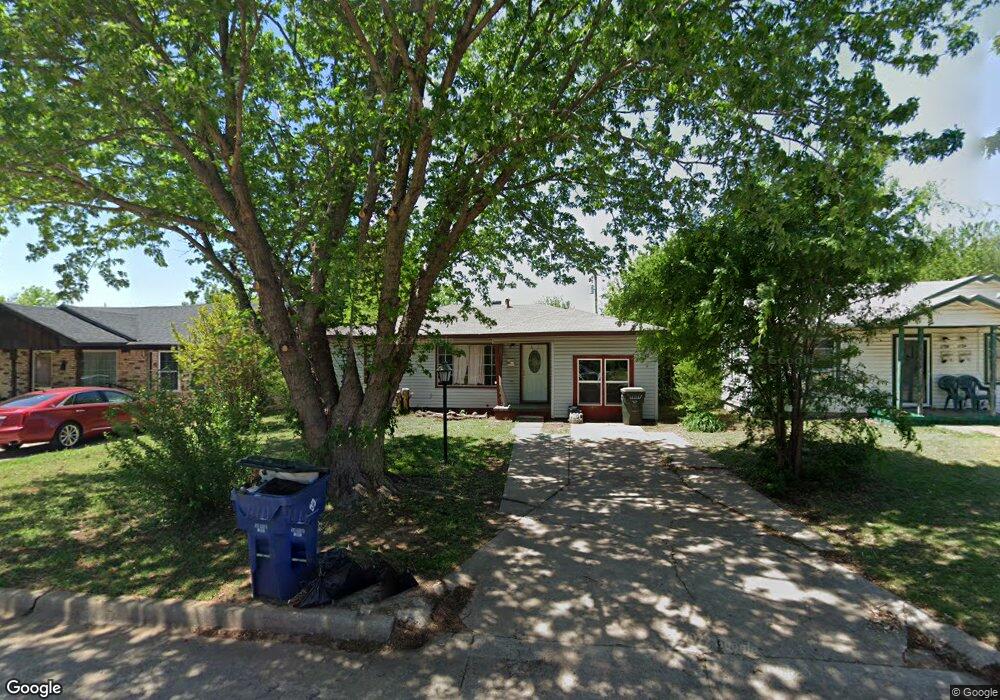
This home is located at 311 S Viola St, Duncan, OK 73533 and is currently estimated at $59,486, approximately $53 per square foot. 311 S Viola St is a home located in Stephens County with nearby schools including Woodrow Wilson Elementary School, Duncan Middle School, and Duncan High School.
Ownership History
Date
Name
Owned For
Owner Type
Purchase Details
Closed on
Feb 12, 2024
Sold by
Red Hot Properties Llp
Bought by
Campbell & Assoc Inv Prop Llc
Current Estimated Value
Purchase Details
Closed on
Jun 29, 2011
Sold by
Head Vinita
Bought by
Red Properties Llp
Purchase Details
Closed on
Jun 13, 2011
Sold by
Graham Janice
Bought by
Head Jay and Head Vanita
Purchase Details
Closed on
Oct 27, 1999
Sold by
King Lorenzo and King Shirley
Purchase Details
Closed on
May 1, 1995
Sold by
Lynn Laura J
Create a Home Valuation Report for This Property
The Home Valuation Report is an in-depth analysis detailing your home's value as well as a comparison with similar homes in the area
Home Values in the Area
Average Home Value in this Area
Purchase History
| Date | Buyer | Sale Price | Title Company |
|---|---|---|---|
| Campbell & Assoc Inv Prop Llc | $30,000 | Stewart Title | |
| Red Properties Llp | $15,000 | None Available | |
| Head Jay | $5,000 | None Available | |
| -- | -- | -- | |
| -- | -- | -- |
Source: Public Records
Tax History Compared to Growth
Tax History
| Year | Tax Paid | Tax Assessment Tax Assessment Total Assessment is a certain percentage of the fair market value that is determined by local assessors to be the total taxable value of land and additions on the property. | Land | Improvement |
|---|---|---|---|---|
| 2025 | $296 | $3,512 | $203 | $3,309 |
| 2024 | $266 | $3,123 | $203 | $2,920 |
| 2023 | $266 | $3,123 | $203 | $2,920 |
| 2022 | $241 | $2,975 | $203 | $2,772 |
| 2021 | $241 | $2,833 | $203 | $2,630 |
| 2020 | $222 | $2,570 | $203 | $2,367 |
| 2019 | $212 | $2,447 | $203 | $2,244 |
| 2018 | $208 | $2,331 | $203 | $2,128 |
| 2017 | $217 | $2,524 | $203 | $2,321 |
| 2016 | $256 | $3,017 | $203 | $2,814 |
| 2015 | $276 | $3,017 | $203 | $2,814 |
| 2014 | $276 | $2,914 | $242 | $2,672 |
Source: Public Records
Map
Nearby Homes