Estimated Value: $213,000 - $236,000
2
Beds
1
Bath
864
Sq Ft
$261/Sq Ft
Est. Value
About This Home
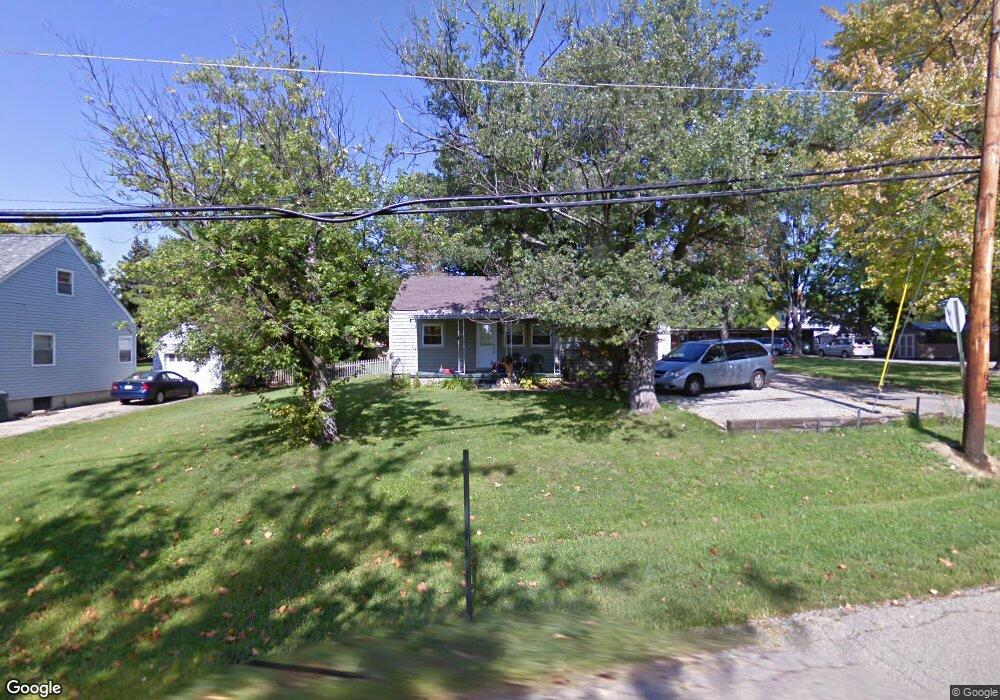
This home is located at 311 S West St, Mason, OH 45040 and is currently estimated at $225,302, approximately $260 per square foot. 311 S West St is a home located in Warren County with nearby schools including Mason Intermediate Elementary School, Mason Middle School, and William Mason High School.
Ownership History
Date
Name
Owned For
Owner Type
Purchase Details
Closed on
Nov 14, 2006
Sold by
Bustle Katie M and Bustle Jeremiah D
Bought by
Bustle Jeremiah D and Bustle Katie M
Current Estimated Value
Home Financials for this Owner
Home Financials are based on the most recent Mortgage that was taken out on this home.
Original Mortgage
$35,000
Outstanding Balance
$20,269
Interest Rate
6.21%
Mortgage Type
Credit Line Revolving
Estimated Equity
$205,033
Purchase Details
Closed on
Aug 29, 2003
Sold by
Mccurley Randy M
Bought by
Eichholz Katie M
Home Financials for this Owner
Home Financials are based on the most recent Mortgage that was taken out on this home.
Original Mortgage
$89,500
Outstanding Balance
$40,081
Interest Rate
6.33%
Mortgage Type
Purchase Money Mortgage
Estimated Equity
$185,221
Purchase Details
Closed on
Dec 30, 1998
Sold by
Calde Jeffery D
Bought by
Mccurley Randy M
Home Financials for this Owner
Home Financials are based on the most recent Mortgage that was taken out on this home.
Original Mortgage
$72,900
Interest Rate
6.95%
Mortgage Type
New Conventional
Purchase Details
Closed on
Jan 14, 1992
Sold by
Dumford Dumford and Dumford Maude
Bought by
Cable Cable and Cable Jeffery D
Create a Home Valuation Report for This Property
The Home Valuation Report is an in-depth analysis detailing your home's value as well as a comparison with similar homes in the area
Home Values in the Area
Average Home Value in this Area
Purchase History
| Date | Buyer | Sale Price | Title Company |
|---|---|---|---|
| Bustle Jeremiah D | -- | American Title Inc | |
| Eichholz Katie M | $90,000 | -- | |
| Mccurley Randy M | $81,000 | -- | |
| Cable Cable | $55,000 | -- |
Source: Public Records
Mortgage History
| Date | Status | Borrower | Loan Amount |
|---|---|---|---|
| Open | Bustle Jeremiah D | $35,000 | |
| Open | Eichholz Katie M | $89,500 | |
| Previous Owner | Mccurley Randy M | $72,900 |
Source: Public Records
Tax History
| Year | Tax Paid | Tax Assessment Tax Assessment Total Assessment is a certain percentage of the fair market value that is determined by local assessors to be the total taxable value of land and additions on the property. | Land | Improvement |
|---|---|---|---|---|
| 2025 | $2,554 | $62,880 | $30,630 | $32,250 |
| 2024 | $2,554 | $62,880 | $30,630 | $32,250 |
| 2023 | $1,907 | $39,641 | $13,475 | $26,166 |
| 2022 | $1,882 | $39,641 | $13,475 | $26,166 |
| 2021 | $1,783 | $39,641 | $13,475 | $26,166 |
| 2020 | $1,891 | $36,036 | $12,250 | $23,786 |
| 2019 | $1,738 | $36,036 | $12,250 | $23,786 |
| 2018 | $1,744 | $36,036 | $12,250 | $23,786 |
| 2017 | $1,753 | $33,814 | $11,638 | $22,176 |
| 2016 | $1,806 | $33,814 | $11,638 | $22,176 |
| 2015 | $1,810 | $33,814 | $11,638 | $22,176 |
| 2014 | $1,941 | $33,810 | $11,640 | $22,180 |
| 2013 | $1,945 | $35,600 | $12,250 | $23,350 |
Source: Public Records
Map
Nearby Homes
- 3 Carnell Place
- 600 W Church St
- 217 E Circle Dr
- 5239 Concord Crossing Dr
- 107 Cowan Dr
- 5496 Red Fox Ct
- 5173 Franklin Park St
- 5104 Lexington Ct
- 5130 Franklin Park St
- 304 E Main St
- 306 E Main St
- 314 E Main St
- 4943 Isaac Ln
- 4922 Bordeaux Ln Unit 4922
- 5615 Wheatmore Ct
- 607 Tylersville Rd
- 220 Kings Mills Rd
- 5670 Villas Creek Dr
- 4782 Bordeaux Ln
- 4734 Margaret Ct
Your Personal Tour Guide
Ask me questions while you tour the home.