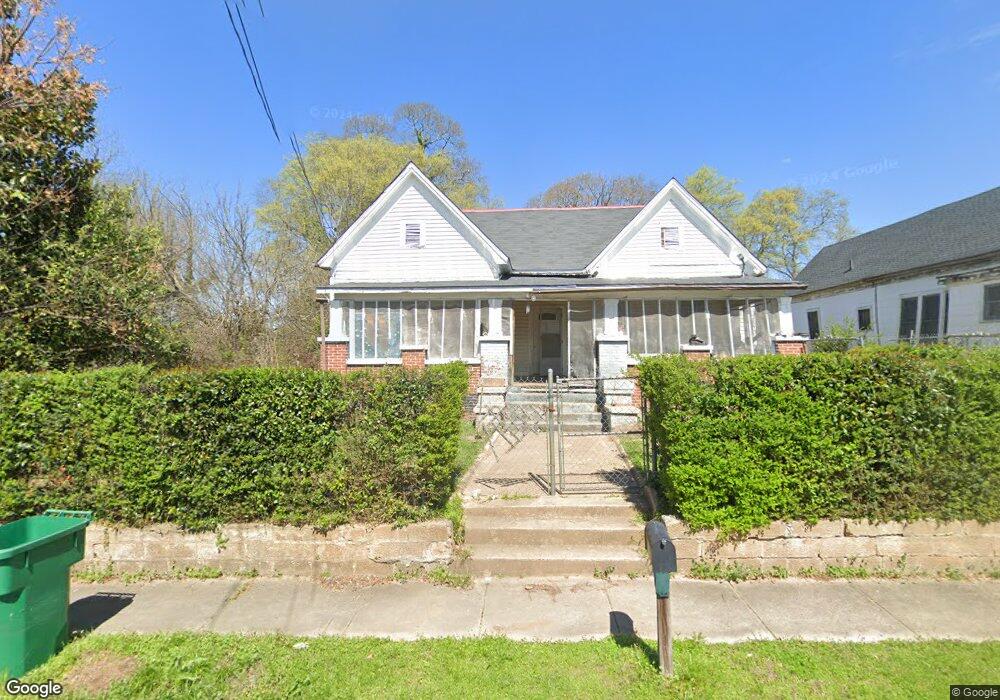
311 Stubbs St Cedartown, GA 30125
Estimated Value: $130,520 - $221,000
3
Beds
1
Bath
1,799
Sq Ft
$97/Sq Ft
Est. Value
About This Home
This home is located at 311 Stubbs St, Cedartown, GA 30125 and is currently estimated at $174,380, approximately $96 per square foot. 311 Stubbs St is a home located in Polk County with nearby schools including Cedar Christian School.
Ownership History
Date
Name
Owned For
Owner Type
Purchase Details
Closed on
Nov 17, 1994
Sold by
Peek Bryan
Bought by
Escutia J Ines
Current Estimated Value
Purchase Details
Closed on
Jun 22, 1990
Sold by
Smith James and Smith Betty
Bought by
Peek Bryan
Purchase Details
Closed on
Mar 23, 1990
Sold by
Pritchard Charles E
Bought by
Smith James and Smith Betty
Purchase Details
Closed on
Sep 4, 1987
Sold by
Tran Van Thien
Bought by
Pritchard Charles E
Purchase Details
Closed on
Oct 25, 1983
Sold by
Elrod Edward William
Bought by
Tran Van Thien
Purchase Details
Closed on
Apr 20, 1983
Sold by
Elrod Jean B
Bought by
Elrod Edward William
Purchase Details
Closed on
May 11, 1972
Sold by
Vance John J
Bought by
Elrod Jean B
Purchase Details
Closed on
Dec 6, 1968
Sold by
Conner W L
Bought by
Vance John J
Purchase Details
Closed on
Jan 1, 1901
Bought by
Conner W L
Create a Home Valuation Report for This Property
The Home Valuation Report is an in-depth analysis detailing your home's value as well as a comparison with similar homes in the area
Home Values in the Area
Average Home Value in this Area
Purchase History
| Date | Buyer | Sale Price | Title Company |
|---|---|---|---|
| Escutia J Ines | $19,900 | -- | |
| Peek Bryan | $19,000 | -- | |
| Smith James | $20,000 | -- | |
| Pritchard Charles E | $20,000 | -- | |
| Tran Van Thien | -- | -- | |
| Elrod Edward William | -- | -- | |
| Elrod Jean B | -- | -- | |
| Vance John J | -- | -- | |
| Conner W L | -- | -- |
Source: Public Records
Tax History Compared to Growth
Tax History
| Year | Tax Paid | Tax Assessment Tax Assessment Total Assessment is a certain percentage of the fair market value that is determined by local assessors to be the total taxable value of land and additions on the property. | Land | Improvement |
|---|---|---|---|---|
| 2024 | $955 | $31,551 | $6,000 | $25,551 |
| 2023 | $761 | $23,314 | $528 | $22,786 |
| 2022 | $430 | $20,124 | $528 | $19,596 |
| 2021 | $436 | $20,124 | $528 | $19,596 |
| 2020 | $437 | $20,124 | $528 | $19,596 |
| 2019 | $428 | $17,922 | $1,450 | $16,472 |
| 2018 | $419 | $17,196 | $1,242 | $15,954 |
| 2017 | $414 | $17,196 | $1,242 | $15,954 |
| 2016 | $310 | $13,377 | $1,242 | $12,134 |
| 2015 | $309 | $13,313 | $1,242 | $12,070 |
| 2014 | $311 | $13,313 | $1,242 | $12,070 |
Source: Public Records
Map
Nearby Homes
- 328 330 Stubbs
- 208 Highland Ave
- 217 E Gibson St
- 537 Fletcher St
- 328 Mountain Home Rd
- 601 Mountain Home Rd
- 226 Central St
- 144 Marshall St
- 129 Thompson St
- 413 Line St
- 419 N Broad St
- 166 Marshall St
- 729 S College St
- 421 Wissahickon Ave
- 427 Wissahickon Ave
- 214 Victoria Ave
- 306 Marshall St
- 210 Merritts Ave
- 408 N College St
- 315 Stubbs St
- 424425 Herbert St
- 323 Stubbs St
- 301 Stubbs St
- 312 Stubbs St
- 308 Herbert St
- 304 Herbert St
- 322 Stubbs St
- 329 Stubbs St
- 302 Stubbs St
- 220 Herbert St
- 310 Stubbs St
- 0 Herbert St Unit 8754373
- 0 Herbert St Unit 8562985
- 0 Herbert St Unit 8511781
- 0 Herbert St Unit 7530229
- 0 Herbert St Unit 7043289
- 0 Herbert St
- 306 Stubbs St
- 219 Stubbs St