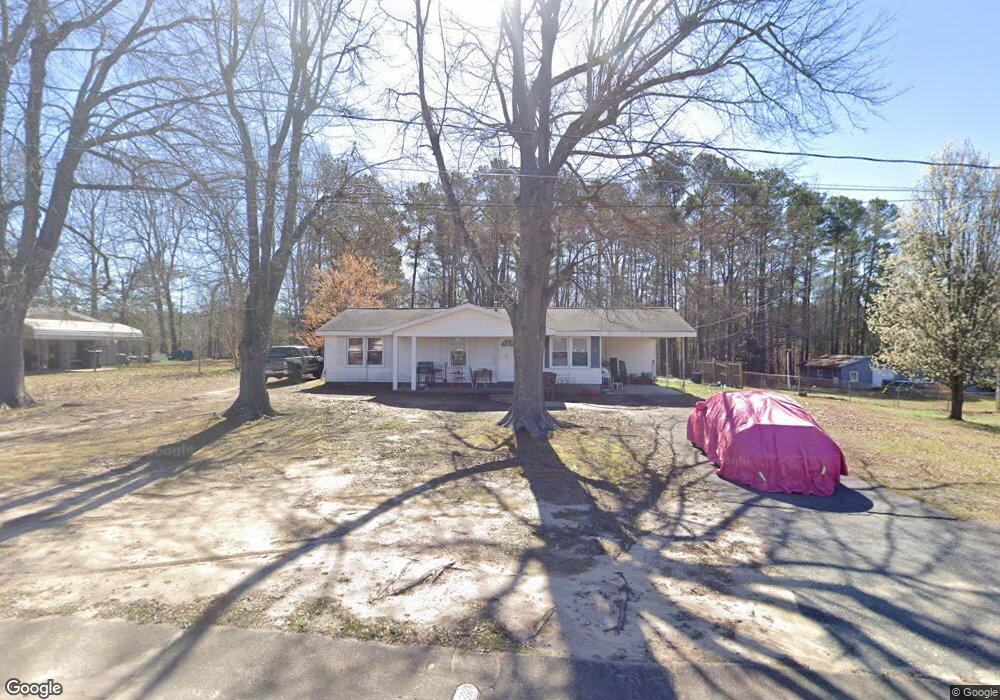
311 Sunset Dr Pacolet, SC 29372
Estimated Value: $85,000 - $155,000
2
Beds
1
Bath
1,020
Sq Ft
$125/Sq Ft
Est. Value
About This Home
This home is located at 311 Sunset Dr, Pacolet, SC 29372 and is currently estimated at $127,371, approximately $124 per square foot. 311 Sunset Dr is a home located in Spartanburg County with nearby schools including Broome High School.
Ownership History
Date
Name
Owned For
Owner Type
Purchase Details
Closed on
Nov 18, 2017
Sold by
Campbell Holcombe Debra G and Holcombe Debra G
Bought by
Cambell Holcombe Debra G and Holcombe Kenneth Bradley
Current Estimated Value
Home Financials for this Owner
Home Financials are based on the most recent Mortgage that was taken out on this home.
Original Mortgage
$77,200
Outstanding Balance
$42,466
Interest Rate
3.88%
Mortgage Type
New Conventional
Estimated Equity
$84,906
Purchase Details
Closed on
Sep 18, 2017
Sold by
Holcombe Debra G
Bought by
Holcombe Debra G and Holcombe Kenneth Bradley
Purchase Details
Closed on
May 8, 2007
Sold by
Sizemore Marvin J
Bought by
Holcombe Debra G
Home Financials for this Owner
Home Financials are based on the most recent Mortgage that was taken out on this home.
Original Mortgage
$71,750
Interest Rate
6.17%
Mortgage Type
Purchase Money Mortgage
Purchase Details
Closed on
Nov 22, 2005
Sold by
Bank Of America Na
Bought by
Sizemore Marvin J
Create a Home Valuation Report for This Property
The Home Valuation Report is an in-depth analysis detailing your home's value as well as a comparison with similar homes in the area
Purchase History
| Date | Buyer | Sale Price | Title Company |
|---|---|---|---|
| Cambell Holcombe Debra G | -- | None Available | |
| Holcombe Debra G | -- | None Available | |
| Holcombe Debra G | $74,000 | None Available | |
| Sizemore Marvin J | $42,500 | -- |
Source: Public Records
Mortgage History
| Date | Status | Borrower | Loan Amount |
|---|---|---|---|
| Open | Cambell Holcombe Debra G | $77,200 | |
| Closed | Holcombe Debra G | $71,750 |
Source: Public Records
Tax History
| Year | Tax Paid | Tax Assessment Tax Assessment Total Assessment is a certain percentage of the fair market value that is determined by local assessors to be the total taxable value of land and additions on the property. | Land | Improvement |
|---|---|---|---|---|
| 2022 | $371 | $3,041 | $417 | $2,624 |
| 2021 | $371 | $3,041 | $417 | $2,624 |
| 2020 | $362 | $3,041 | $417 | $2,624 |
| 2019 | $390 | $3,041 | $417 | $2,624 |
| 2018 | $350 | $3,041 | $417 | $2,624 |
| 2017 | $257 | $2,644 | $320 | $2,324 |
| 2016 | $721 | $2,644 | $320 | $2,324 |
| 2015 | $709 | $2,644 | $320 | $2,324 |
| 2014 | $704 | $2,644 | $320 | $2,324 |
Source: Public Records
Map
Nearby Homes
- 411 Hillbrook Cir
- 711 Hillbrook Cir
- 131 Church St
- 151 Glenn Springs Rd
- 181 N Hwy 150 Hwy
- 244 Kailin Shea Ave
- Quarter Round Rd
- Quarter Round Rd
- Quarter Round Rd
- 224 Kailin Shea Ave
- 591 Dogwood Cir
- 0 Norwood St
- 1050 S Carolina 150
- 245 Kelli Ct
- 121 State Road S-42-2485
- 296 Gaston St
- 491 Spruce St
- 115 Applewood St
- 931 N Highway 150
- 00 State Road S-42-366
Your Personal Tour Guide
Ask me questions while you tour the home.