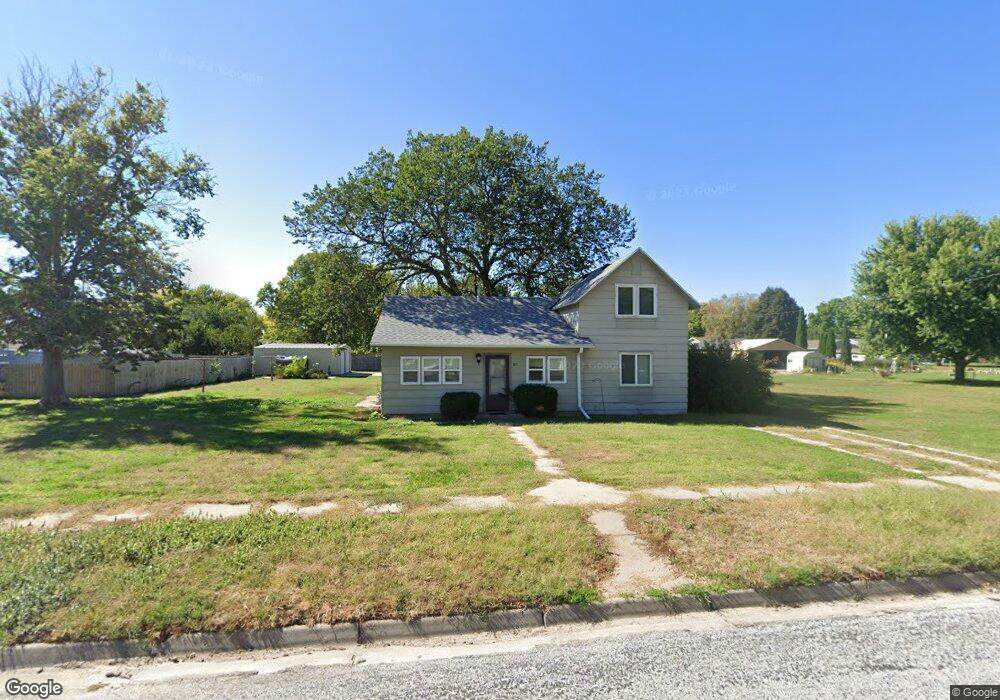
311 Union St Bertrand, NE 68927
Estimated Value: $93,000 - $150,000
Studio
--
Bath
1,152
Sq Ft
$109/Sq Ft
Est. Value
About This Home
This home is located at 311 Union St, Bertrand, NE 68927 and is currently estimated at $125,842, approximately $109 per square foot. 311 Union St is a home located in Phelps County with nearby schools including Bertrand Elementary School and Bertrand High School.
Ownership History
Date
Name
Owned For
Owner Type
Purchase Details
Closed on
Mar 26, 2010
Sold by
Brekel Leo and Brekel Debra S
Bought by
Wood Tara L
Current Estimated Value
Home Financials for this Owner
Home Financials are based on the most recent Mortgage that was taken out on this home.
Original Mortgage
$61,119
Outstanding Balance
$40,026
Interest Rate
4.9%
Mortgage Type
New Conventional
Estimated Equity
$85,816
Purchase Details
Closed on
Aug 7, 2008
Sold by
Perrin Denise M and Perrin Timothy H
Bought by
Hock Byron P and Hock Rebecca S
Home Financials for this Owner
Home Financials are based on the most recent Mortgage that was taken out on this home.
Original Mortgage
$38,000
Interest Rate
6.47%
Mortgage Type
Future Advance Clause Open End Mortgage
Create a Home Valuation Report for This Property
The Home Valuation Report is an in-depth analysis detailing your home's value as well as a comparison with similar homes in the area
Purchase History
| Date | Buyer | Sale Price | Title Company |
|---|---|---|---|
| Wood Tara L | $60,000 | -- | |
| Hock Byron P | $40,000 | -- |
Source: Public Records
Mortgage History
| Date | Status | Borrower | Loan Amount |
|---|---|---|---|
| Open | Wood Tara L | $61,119 | |
| Previous Owner | Hock Byron P | $38,000 |
Source: Public Records
Tax History
| Year | Tax Paid | Tax Assessment Tax Assessment Total Assessment is a certain percentage of the fair market value that is determined by local assessors to be the total taxable value of land and additions on the property. | Land | Improvement |
|---|---|---|---|---|
| 2025 | $1,230 | $84,280 | $11,160 | $73,120 |
| 2024 | $1,290 | $75,240 | $11,160 | $64,080 |
| 2023 | $1,290 | $61,093 | $8,928 | $52,165 |
| 2022 | $1,308 | $61,093 | $8,928 | $52,165 |
| 2021 | $1,198 | $56,113 | $8,928 | $47,185 |
| 2020 | $1,132 | $53,443 | $8,928 | $44,515 |
| 2019 | $763 | $51,458 | $8,928 | $42,530 |
| 2018 | $689 | $51,458 | $8,928 | $42,530 |
| 2017 | $713 | $49,805 | $7,290 | $42,515 |
| 2016 | $680 | $47,845 | $7,290 | $40,555 |
| 2015 | $681 | $47,845 | $7,290 | $40,555 |
| 2014 | $795 | $49,655 | $7,290 | $42,365 |
| 2013 | $795 | $49,655 | $7,290 | $42,365 |
Source: Public Records
Map
Nearby Homes
- 303 Bryan St
- Lexington Unit NE 68850
- Lexington Unit NE 68850
- 108 Bryan St
- Lexington Unit NE 68850
- TRACT I Huber Addition
- 803 Smith Ave
- 711 Smith Ave
- 1306 Maberly St
- 901 Maberly St
- 815 Tibbals St
- 73803 Highway 183
- 1023 Hancock St
- 1019 Hancock St
- 117 W 3rd Ave
- 602 11th Ave
- 1305 East Ave
- 1010 East Ave
- 816 Garfield St
- 915 Sherman St
Your Personal Tour Guide
Ask me questions while you tour the home.