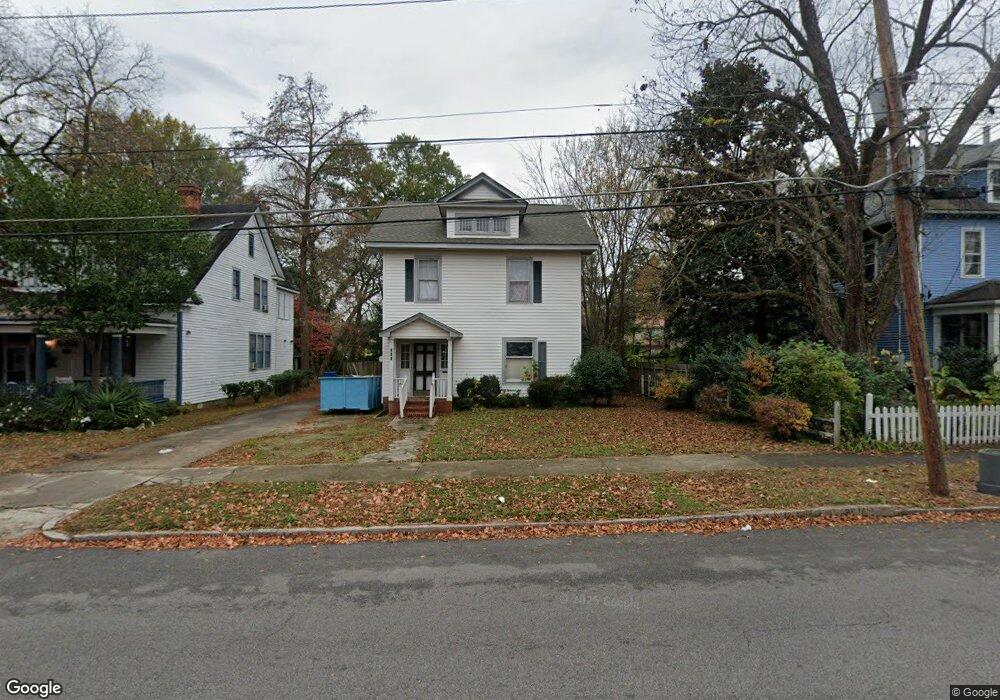
311 Vance St NE Wilson, NC 27893
Estimated Value: $124,000 - $259,000
5
Beds
3
Baths
3,000
Sq Ft
$64/Sq Ft
Est. Value
About This Home
This home is located at 311 Vance St NE, Wilson, NC 27893 and is currently estimated at $190,844, approximately $63 per square foot. 311 Vance St NE is a home located in Wilson County with nearby schools including Margaret Hearne Elementary School, Toisnot Middle School, and Fike High School.
Ownership History
Date
Name
Owned For
Owner Type
Purchase Details
Closed on
May 1, 2024
Sold by
Skinner Darren L and Skinner Tora B
Bought by
Moran Santos Neftali and Velazq Hernandez Margarita
Current Estimated Value
Home Financials for this Owner
Home Financials are based on the most recent Mortgage that was taken out on this home.
Original Mortgage
$110,000
Outstanding Balance
$103,770
Interest Rate
6.11%
Mortgage Type
Seller Take Back
Estimated Equity
$87,074
Purchase Details
Closed on
Jan 28, 2009
Sold by
Blue Ridge Financial Solutions Llc
Bought by
Skinner Darren L
Purchase Details
Closed on
Jul 13, 2006
Sold by
Free Will Baptist Childrens Home Inc
Bought by
Sherrod Carolyn
Home Financials for this Owner
Home Financials are based on the most recent Mortgage that was taken out on this home.
Original Mortgage
$59,250
Interest Rate
12.55%
Mortgage Type
Adjustable Rate Mortgage/ARM
Create a Home Valuation Report for This Property
The Home Valuation Report is an in-depth analysis detailing your home's value as well as a comparison with similar homes in the area
Home Values in the Area
Average Home Value in this Area
Purchase History
| Date | Buyer | Sale Price | Title Company |
|---|---|---|---|
| Moran Santos Neftali | $110,000 | None Listed On Document | |
| Moran Santos Neftali | $110,000 | None Listed On Document | |
| Skinner Darren L | $15,000 | None Available | |
| Sherrod Carolyn | $56,000 | -- |
Source: Public Records
Mortgage History
| Date | Status | Borrower | Loan Amount |
|---|---|---|---|
| Open | Moran Santos Neftali | $110,000 | |
| Closed | Moran Santos Neftali | $110,000 | |
| Previous Owner | Sherrod Carolyn | $59,250 |
Source: Public Records
Tax History Compared to Growth
Tax History
| Year | Tax Paid | Tax Assessment Tax Assessment Total Assessment is a certain percentage of the fair market value that is determined by local assessors to be the total taxable value of land and additions on the property. | Land | Improvement |
|---|---|---|---|---|
| 2025 | $1,393 | $168,082 | $35,000 | $133,082 |
| 2024 | $1,393 | $168,082 | $35,000 | $133,082 |
| 2023 | $1,469 | $112,551 | $20,000 | $92,551 |
| 2022 | $1,469 | $112,551 | $20,000 | $92,551 |
| 2021 | $1,469 | $112,551 | $20,000 | $92,551 |
| 2020 | $1,469 | $112,551 | $20,000 | $92,551 |
| 2019 | $1,469 | $112,551 | $20,000 | $92,551 |
| 2018 | $1,469 | $112,551 | $20,000 | $92,551 |
| 2017 | $1,446 | $112,551 | $20,000 | $92,551 |
| 2016 | $1,446 | $112,551 | $20,000 | $92,551 |
| 2014 | $1,514 | $121,627 | $20,000 | $101,627 |
Source: Public Records
Map
Nearby Homes
- 206 Vance St NE
- 310 Maplewood Ave NE
- 500 Vance St NE
- 109 Bragg St NE
- 3023 Winding Ridge Dr
- 204 Lee St NE
- 307 Broad St W
- 209 Daniel St W
- 506 Kenan St W
- 207 Bruton St W
- 313 Railroad St E
- 700 Kenan St W
- 704 Vance St E
- 703 Broad St W
- 711 Kenan St W
- 701 Franklin Ave W
- 806 Vance St N
- 900 Nash St N
- 505 Green St E
- 909 Lee St N
- 309 Vance St NE
- 313 Vance St E
- 313 Vance St NE
- 208 Hill St NE
- 307 Vance St NE
- 308 Vance St NE
- 308 Vance St E
- 400 Vance St NE
- 211 Hill St NE
- 306 Vance St NE
- 306 Vance St E
- 304 Vance St NE
- 209 Maplewood Ave NE
- 301 Vance St NE
- 400 Vance St NE
- 209 Hill St NE
- 400 Vance St E
- 304 Hill St NE
- 205 Maplewood Ave NE
- 205 Hill St NE