Estimated Value: $651,000 - $697,157
4
Beds
4
Baths
2,705
Sq Ft
$251/Sq Ft
Est. Value
About This Home
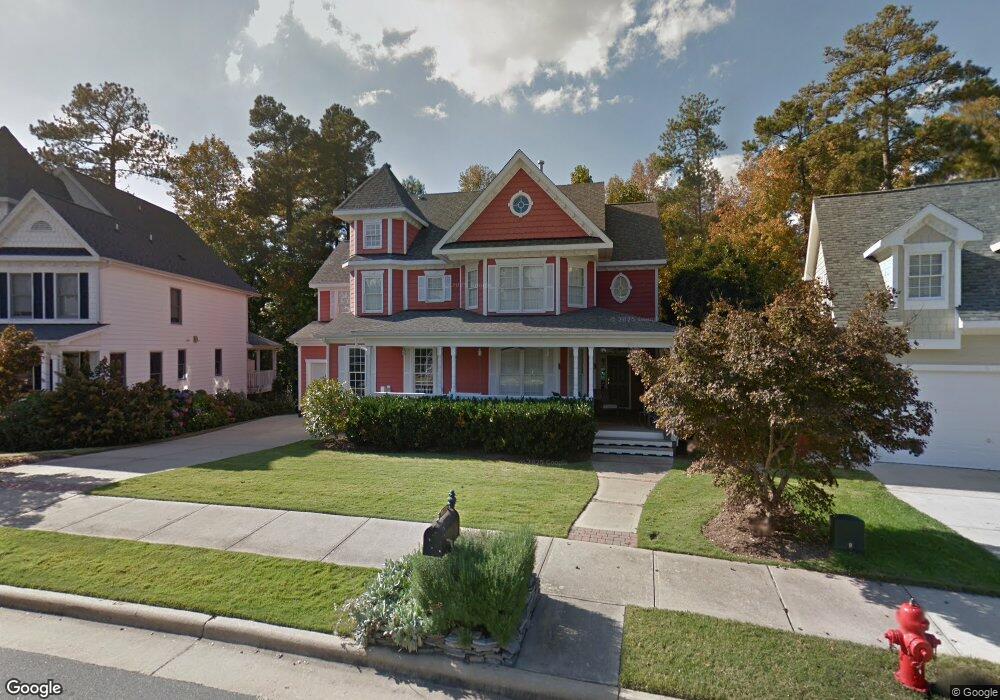
This home is located at 311 Village Loop Dr, Apex, NC 27502 and is currently estimated at $678,039, approximately $250 per square foot. 311 Village Loop Dr is a home located in Wake County with nearby schools including Scotts Ridge Elementary School, Apex Middle, and Apex High School.
Ownership History
Date
Name
Owned For
Owner Type
Purchase Details
Closed on
Mar 12, 2014
Sold by
Taggart Andrea
Bought by
Kedrowski Ryan David and Kedrowski Jennifer Lynn
Current Estimated Value
Home Financials for this Owner
Home Financials are based on the most recent Mortgage that was taken out on this home.
Original Mortgage
$337,250
Outstanding Balance
$255,720
Interest Rate
4.35%
Mortgage Type
New Conventional
Estimated Equity
$422,319
Purchase Details
Closed on
Feb 25, 2011
Sold by
Taggart James V
Bought by
Taggart Andrea
Purchase Details
Closed on
Jan 31, 2002
Sold by
Biltmore Homes Llc
Bought by
Taggart James and Taggart Andrea
Home Financials for this Owner
Home Financials are based on the most recent Mortgage that was taken out on this home.
Original Mortgage
$99,500
Interest Rate
5.12%
Create a Home Valuation Report for This Property
The Home Valuation Report is an in-depth analysis detailing your home's value as well as a comparison with similar homes in the area
Home Values in the Area
Average Home Value in this Area
Purchase History
| Date | Buyer | Sale Price | Title Company |
|---|---|---|---|
| Kedrowski Ryan David | $355,000 | None Available | |
| Taggart Andrea | -- | None Available | |
| Taggart James | $326,000 | -- |
Source: Public Records
Mortgage History
| Date | Status | Borrower | Loan Amount |
|---|---|---|---|
| Open | Kedrowski Ryan David | $337,250 | |
| Previous Owner | Taggart James | $99,500 |
Source: Public Records
Tax History Compared to Growth
Tax History
| Year | Tax Paid | Tax Assessment Tax Assessment Total Assessment is a certain percentage of the fair market value that is determined by local assessors to be the total taxable value of land and additions on the property. | Land | Improvement |
|---|---|---|---|---|
| 2025 | $5,539 | $632,110 | $138,000 | $494,110 |
| 2024 | $5,415 | $632,110 | $138,000 | $494,110 |
| 2023 | $4,889 | $443,834 | $66,000 | $377,834 |
| 2022 | $4,589 | $443,834 | $66,000 | $377,834 |
| 2021 | $4,414 | $443,834 | $66,000 | $377,834 |
| 2020 | $4,370 | $443,834 | $66,000 | $377,834 |
| 2019 | $4,157 | $364,250 | $66,000 | $298,250 |
| 2018 | $3,915 | $364,250 | $66,000 | $298,250 |
| 2017 | $3,644 | $364,250 | $66,000 | $298,250 |
| 2016 | $3,591 | $364,250 | $66,000 | $298,250 |
| 2015 | $2,749 | $371,202 | $70,400 | $300,802 |
| 2014 | $2,595 | $348,625 | $70,400 | $278,225 |
Source: Public Records
Map
Nearby Homes
- 402 Village Loop Dr
- 441 Heritage Village Ln
- 428 Heritage Village Ln
- 541 Village Loop Dr
- 448 Heritage Village Ln
- 460 Heritage Village Ln
- 104 Pine Tag Ct
- 1773 Town Home Dr
- 1311 Pendula Path
- 103 Garden Side Way
- 209 Homegate Cir
- 1131 Bungalow Park Dr
- 1880 Woodall Crest Dr
- 0 Jb Morgan Rd Unit 10051948
- 1910 Woodall Crest Dr
- 1844 Woodall Crest Dr
- 3014 Silky Dogwood Trail
- 2008 Silky Dogwood Trail
- 1208 Tartarian Trail
- 1105 Capitata Crossing
- 309 Village Loop Dr
- 313 Village Loop Dr
- 106 White Magnolia Ct
- 307 Village Loop Dr
- 315 Village Loop Dr
- 104 White Magnolia Ct
- 310 Village Loop Dr
- 312 Village Loop Dr
- 107 White Magnolia Ct
- 317 Village Loop Dr
- 306 Village Loop Dr
- 316 Village Loop Dr
- 305 Village Loop Dr
- 102 White Magnolia Ct
- 555 Oak Pine Dr
- 777 Oak Pine Dr
- 304 Village Loop Dr
- 318 Village Loop Dr
- 406 Maple Creek Ct
- 105 White Magnolia Ct