
Seller's Agent in 2015
Hugh Dugan
Hugh D. Dugan Real Estate Inc
(570) 778-6635
21 in this area
96 Total Sales
Estimated Value: $154,000 - $223,485
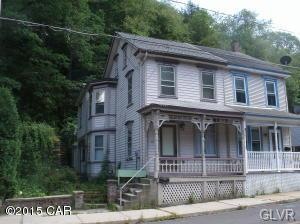
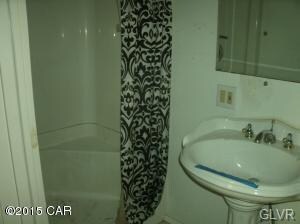
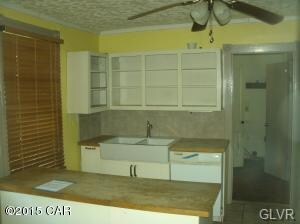
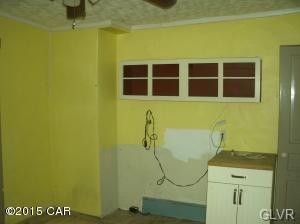
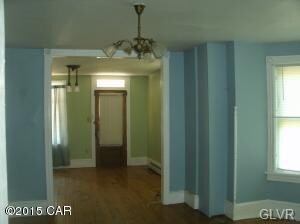
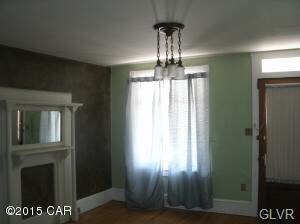
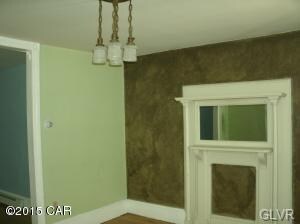
This house has the one thing that is needed on Broadway... Parking! **Motivated seller** 3 bedroom 2 bath Victorian twin with original woodwork and brass fixtures. The kitchen features solid oak butcher block countertops. Convenience of first floor laundry room and the peace of mind of a newer roof.
| Date | Buyer | Sale Price | Title Company |
|---|---|---|---|
| Loyd Carol L | $63,800 | None Available | |
| Celestial Equities Inc | $99,000 | None Available |
| Date | Event | Price | List to Sale | Price per Sq Ft |
|---|---|---|---|---|
| 11/25/2015 11/25/15 | Sold | $63,800 | -46.4% | $46 / Sq Ft |
| 10/21/2015 10/21/15 | Pending | -- | -- | -- |
| 09/08/2014 09/08/14 | For Sale | $119,000 | -- | $85 / Sq Ft |
| Year | Tax Paid | Tax Assessment Tax Assessment Total Assessment is a certain percentage of the fair market value that is determined by local assessors to be the total taxable value of land and additions on the property. | Land | Improvement |
|---|---|---|---|---|
| 2025 | $3,084 | $38,850 | $14,250 | $24,600 |
| 2024 | $2,967 | $38,850 | $14,250 | $24,600 |
| 2023 | $2,913 | $38,850 | $14,250 | $24,600 |
| 2022 | $2,866 | $38,850 | $14,250 | $24,600 |
| 2021 | $2,866 | $38,850 | $14,250 | $24,600 |
| 2020 | $2,767 | $38,850 | $14,250 | $24,600 |
| 2019 | $2,689 | $38,850 | $14,250 | $24,600 |
| 2018 | $2,629 | $38,850 | $14,250 | $24,600 |
| 2017 | $2,551 | $38,850 | $14,250 | $24,600 |
| 2016 | -- | $38,850 | $14,250 | $24,600 |
| 2015 | -- | $38,850 | $14,250 | $24,600 |
| 2014 | -- | $38,850 | $14,250 | $24,600 |
Seller's Agent in 2015
Hugh Dugan
Hugh D. Dugan Real Estate Inc
(570) 778-6635
21 in this area
96 Total Sales
Source: Greater Lehigh Valley REALTORS®
MLS Number: CC3857
APN: 83A1-19-D24
Disclaimer: Certain information contained herein is derived from information provided by parties other than Homes.com. All information provided is deemed reliable, but is not guaranteed to be accurate and should be independently verified.
![]() IDX information is provided exclusively for personal, non-commercial use, and may not be used for any purpose other than to identify prospective properties consumers may be interested in purchasing.
IDX information is provided exclusively for personal, non-commercial use, and may not be used for any purpose other than to identify prospective properties consumers may be interested in purchasing.
Information is deemed reliable but not guaranteed.