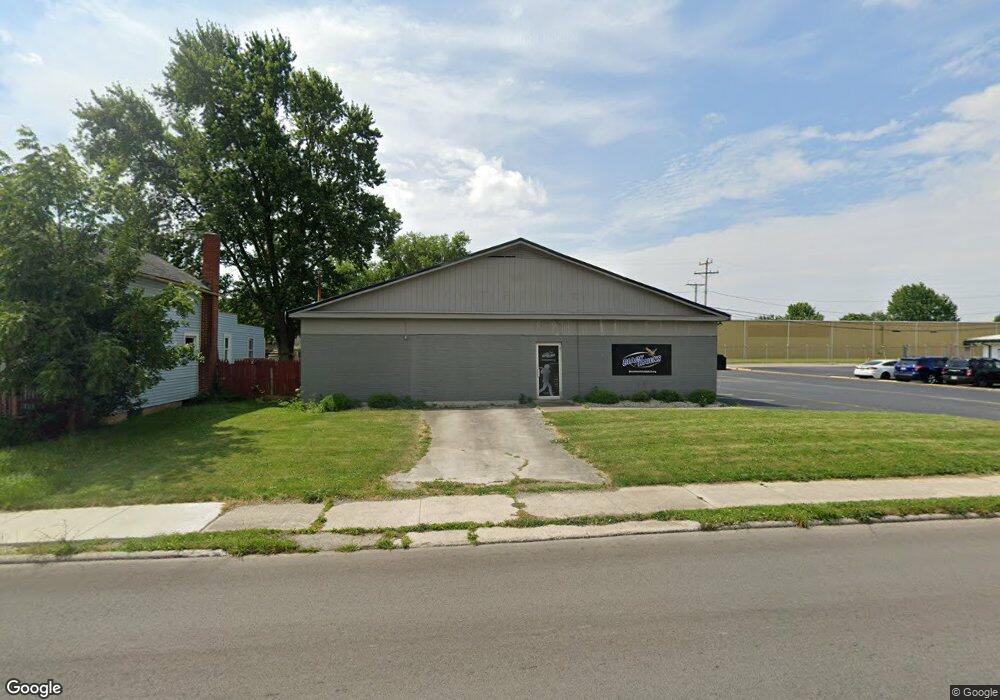
311 W Lytle St Fostoria, OH 44830
--
Bed
--
Bath
3,640
Sq Ft
--
Built
About This Home
This home is located at 311 W Lytle St, Fostoria, OH 44830. 311 W Lytle St is a home located in Seneca County with nearby schools including Fostoria Intermediate Elementary School and Fostoria Junior/Senior High School.
Ownership History
Date
Name
Owned For
Owner Type
Purchase Details
Closed on
Aug 25, 2020
Sold by
Shoestring Inc
Bought by
Blackhawks Fast Pitch
Purchase Details
Closed on
May 16, 1997
Bought by
Shoestring Inc
Create a Home Valuation Report for This Property
The Home Valuation Report is an in-depth analysis detailing your home's value as well as a comparison with similar homes in the area
Home Values in the Area
Average Home Value in this Area
Purchase History
| Date | Buyer | Sale Price | Title Company |
|---|---|---|---|
| Blackhawks Fast Pitch | $45,000 | Mid American Title Agcy Inc | |
| Shoestring Inc | $65,000 | -- |
Source: Public Records
Tax History Compared to Growth
Tax History
| Year | Tax Paid | Tax Assessment Tax Assessment Total Assessment is a certain percentage of the fair market value that is determined by local assessors to be the total taxable value of land and additions on the property. | Land | Improvement |
|---|---|---|---|---|
| 2024 | $2,594 | $36,540 | $1,830 | $34,710 |
| 2023 | $2,592 | $36,540 | $1,830 | $34,710 |
| 2022 | $1,986 | $24,920 | $4,200 | $20,720 |
| 2021 | $2,023 | $24,920 | $4,200 | $20,720 |
| 2020 | $2,027 | $24,914 | $4,197 | $20,717 |
| 2019 | $1,974 | $24,399 | $4,197 | $20,202 |
| 2018 | $1,996 | $24,399 | $4,197 | $20,202 |
| 2017 | $1,870 | $24,399 | $4,197 | $20,202 |
| 2016 | $1,788 | $23,671 | $4,197 | $19,474 |
| 2015 | $1,759 | $23,671 | $4,197 | $19,474 |
| 2014 | $1,703 | $23,671 | $4,197 | $19,474 |
| 2013 | $1,787 | $23,671 | $4,197 | $19,474 |
Source: Public Records
Map
Nearby Homes
- 461 W Lytle St
- 461 W Lytle St Unit 145
- 461 W Lytle St Unit 106
- 351 W South St
- 348 W South St
- 0 W South Route 12
- 133 E South St
- 634 W Tiffin St
- 203 N Union St
- 509 College Ave
- 321 Mcdougal St
- 0 Bradner St
- 520 N Union St
- 412 E Center St
- 603 N Vine St
- 540 N Poplar St
- 723 N Union St
- 211 Summit St
- 129 Fall St
- 633 Maple St
- 309 W Lytle St
- 307 W Lytle St
- 303 W Lytle St
- 721 S Union St
- 320 W Lytle St
- 324 W Lytle St
- 725 S Union St
- 733 S Union St
- 339 W Lytle St
- 330 W Lytle St
- 318 W Lytle St
- 332 W Lytle St
- 700 S Union St
- 708 S Union St
- 712 S Union St
- 720 S Union St
- 311 Bannister St
- 620 S Union St
- 319 Bannister St
- 614 S Union St