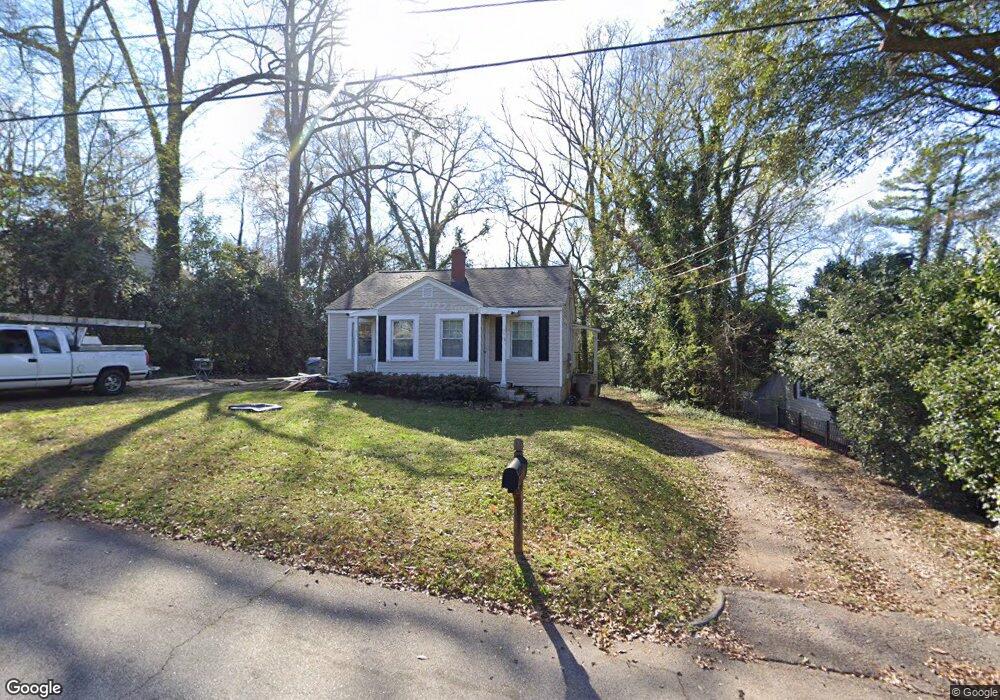
311 W Mclendon Cir Lagrange, GA 30240
Estimated Value: $183,000 - $233,460
4
Beds
2
Baths
1,680
Sq Ft
$120/Sq Ft
Est. Value
About This Home
This home is located at 311 W Mclendon Cir, Lagrange, GA 30240 and is currently estimated at $202,115, approximately $120 per square foot. 311 W Mclendon Cir is a home located in Troup County with nearby schools including Hollis Hand Elementary School, Ethel W. Kight Elementary School, and Franklin Forest Elementary School.
Ownership History
Date
Name
Owned For
Owner Type
Purchase Details
Closed on
Aug 1, 2024
Sold by
Titus Kyle
Bought by
Titus Chelsea
Current Estimated Value
Purchase Details
Closed on
Jun 30, 2022
Sold by
Riggs Timothy C
Bought by
Titus Chelsea and Titus Kyle
Home Financials for this Owner
Home Financials are based on the most recent Mortgage that was taken out on this home.
Original Mortgage
$123,750
Interest Rate
5.09%
Mortgage Type
New Conventional
Purchase Details
Closed on
Jul 14, 2004
Sold by
Gayle F Middlebrooks
Bought by
Riggs Timothy C and Angela Renee
Purchase Details
Closed on
Apr 15, 2004
Sold by
Daniel Emmett Fling
Bought by
Gayle F Middlebrooks
Purchase Details
Closed on
Dec 7, 1972
Sold by
Freeman Enterprises Inc
Bought by
Daniel Emmett Fling
Purchase Details
Closed on
Jul 7, 1970
Sold by
First Federal Savings & Loan
Bought by
Freeman Enterprises Inc
Purchase Details
Closed on
Jul 1, 1963
Sold by
Freeman C Ralph
Bought by
First Federal Savings & Loan
Create a Home Valuation Report for This Property
The Home Valuation Report is an in-depth analysis detailing your home's value as well as a comparison with similar homes in the area
Home Values in the Area
Average Home Value in this Area
Purchase History
| Date | Buyer | Sale Price | Title Company |
|---|---|---|---|
| Titus Chelsea | -- | -- | |
| Titus Chelsea | $165,000 | -- | |
| Riggs Timothy C | $42,500 | -- | |
| Gayle F Middlebrooks | -- | -- | |
| Daniel Emmett Fling | $12,000 | -- | |
| Freeman Enterprises Inc | -- | -- | |
| First Federal Savings & Loan | -- | -- |
Source: Public Records
Mortgage History
| Date | Status | Borrower | Loan Amount |
|---|---|---|---|
| Previous Owner | Titus Chelsea | $123,750 |
Source: Public Records
Tax History Compared to Growth
Tax History
| Year | Tax Paid | Tax Assessment Tax Assessment Total Assessment is a certain percentage of the fair market value that is determined by local assessors to be the total taxable value of land and additions on the property. | Land | Improvement |
|---|---|---|---|---|
| 2024 | $1,884 | $69,080 | $18,000 | $51,080 |
| 2023 | $1,748 | $64,080 | $18,000 | $46,080 |
| 2022 | $1,350 | $48,360 | $14,000 | $34,360 |
| 2021 | $1,177 | $39,040 | $14,000 | $25,040 |
| 2020 | $1,177 | $39,040 | $14,000 | $25,040 |
| 2019 | $1,177 | $39,040 | $14,000 | $25,040 |
| 2018 | $1,177 | $39,040 | $14,000 | $25,040 |
| 2017 | $1,115 | $36,960 | $18,000 | $18,960 |
| 2016 | $1,108 | $36,740 | $18,000 | $18,740 |
| 2015 | $1,110 | $36,740 | $18,000 | $18,740 |
| 2014 | $1,100 | $36,354 | $18,000 | $18,354 |
| 2013 | -- | $29,777 | $7,680 | $22,097 |
Source: Public Records
Map
Nearby Homes
- 105 Saynor Cir
- 203 Waverly Way
- 408 Gordon St
- 110 Waverly Way
- 109 Waverly Way
- 206 Broad St
- 209 Boulevard
- 208 Boulevard
- 609 Cherokee Rd
- 705 Piney Woods Dr
- 609 Ridley Ave
- 707 Ridley Ave
- 611 Ridley Ave
- 615 Ridley Ave
- 709 Ridley Ave
- 0 Ridley Ave Unit 10550104
- 500 Boulevard
- 513 Park Ave
- 505 S Lewis St
- 217 Jefferson St
- 309 W Mclendon Cir
- 315 W Mclendon Cir
- W W Mclendon Cir
- 307 W Mclendon Cir
- 304 Springdale Dr
- 319 W Mclendon Cir
- 300 Springdale Dr
- 306 Springdale Dr
- 303 W Mclendon Cir
- 308 Springdale Dr
- 323 W Mclendon Cir
- 208 Springdale Dr
- 204 Ben Hill St
- 400 Springdale Dr
- E E Mclendon Cir
- 301 W Mclendon Cir
- 301 Springdale Dr Unit Lot 4
- 320 E Mclendon Cir
- 204 Springdale Dr
- 303 305 307 Springdale Dr