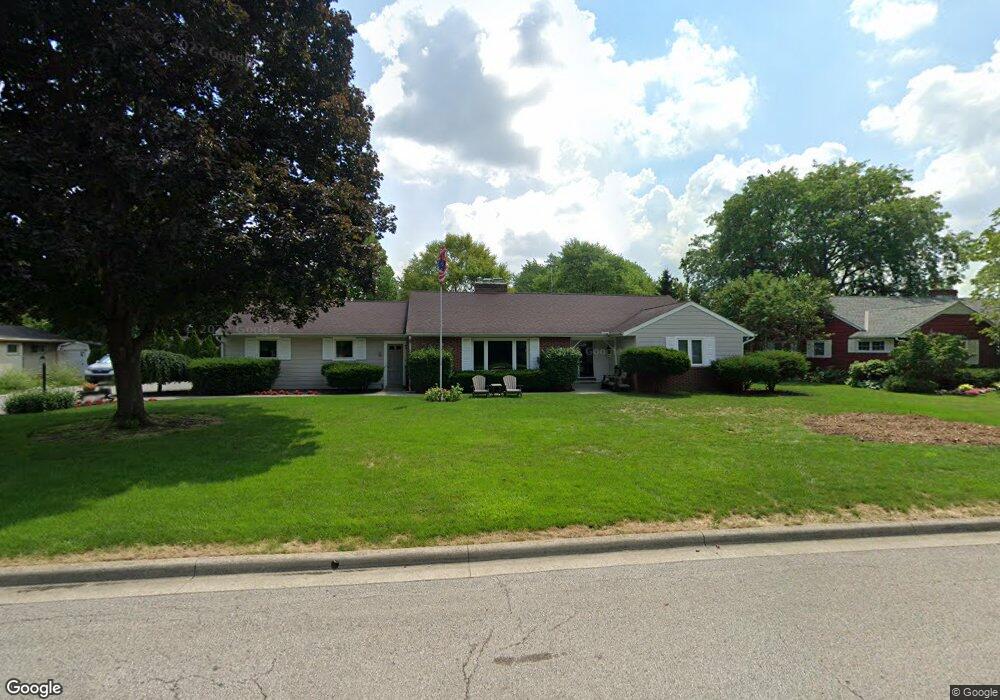
3110 Bembridge Rd Columbus, OH 43221
Estimated Value: $632,000 - $811,000
3
Beds
3
Baths
2,468
Sq Ft
$293/Sq Ft
Est. Value
About This Home
This home is located at 3110 Bembridge Rd, Columbus, OH 43221 and is currently estimated at $723,382, approximately $293 per square foot. 3110 Bembridge Rd is a home located in Franklin County with nearby schools including Tremont Elementary School, Jones Middle School, and Upper Arlington High School.
Ownership History
Date
Name
Owned For
Owner Type
Purchase Details
Closed on
Jun 30, 2003
Sold by
Yesso John M and Yesso Judith B
Bought by
Ryan Scott A and Ryan Beth C
Current Estimated Value
Home Financials for this Owner
Home Financials are based on the most recent Mortgage that was taken out on this home.
Original Mortgage
$243,300
Outstanding Balance
$104,218
Interest Rate
5.36%
Mortgage Type
Purchase Money Mortgage
Estimated Equity
$619,164
Purchase Details
Closed on
Jan 6, 1995
Sold by
Knoderer Jessie P
Bought by
Yesso John M and Yesso Judith B
Home Financials for this Owner
Home Financials are based on the most recent Mortgage that was taken out on this home.
Original Mortgage
$159,000
Interest Rate
5.75%
Mortgage Type
New Conventional
Create a Home Valuation Report for This Property
The Home Valuation Report is an in-depth analysis detailing your home's value as well as a comparison with similar homes in the area
Home Values in the Area
Average Home Value in this Area
Purchase History
| Date | Buyer | Sale Price | Title Company |
|---|---|---|---|
| Ryan Scott A | $286,300 | -- | |
| Yesso John M | $199,000 | -- |
Source: Public Records
Mortgage History
| Date | Status | Borrower | Loan Amount |
|---|---|---|---|
| Open | Ryan Scott A | $243,300 | |
| Closed | Yesso John M | $159,000 |
Source: Public Records
Tax History Compared to Growth
Tax History
| Year | Tax Paid | Tax Assessment Tax Assessment Total Assessment is a certain percentage of the fair market value that is determined by local assessors to be the total taxable value of land and additions on the property. | Land | Improvement |
|---|---|---|---|---|
| 2024 | $10,975 | $189,570 | $74,660 | $114,910 |
| 2023 | $10,839 | $189,570 | $74,660 | $114,910 |
| 2022 | $10,776 | $154,220 | $61,500 | $92,720 |
| 2021 | $9,540 | $154,220 | $61,500 | $92,720 |
| 2020 | $9,455 | $154,220 | $61,500 | $92,720 |
| 2019 | $8,784 | $126,670 | $61,500 | $65,170 |
| 2018 | $7,928 | $126,670 | $61,500 | $65,170 |
| 2017 | $7,922 | $126,670 | $61,500 | $65,170 |
| 2016 | $7,128 | $107,810 | $45,050 | $62,760 |
| 2015 | $7,122 | $107,810 | $45,050 | $62,760 |
| 2014 | $7,130 | $107,810 | $45,050 | $62,760 |
| 2013 | $3,404 | $98,000 | $40,950 | $57,050 |
Source: Public Records
Map
Nearby Homes
- 3156 Mt Holyoke Rd
- 3015 Welsford Rd
- 2835 Katmai Dr
- 1764 Ridgecliff Rd Unit 1764
- 3175 Tremont Rd Unit 502
- 1560 Pemberton Dr
- 1205 Sunny Hill Dr
- 1887-1891 Kentwell Rd
- 3444 Sunningdale Way
- 3106 Somerford Rd
- 1767 Riverhill Rd
- 1909 Inchcliff Rd
- 1098 Stanhope Dr
- 3296 Leighton Rd
- 1111 Sunny Hill Dr
- 3526 Rue de Fleur Unit B18U
- 2648 Chester Rd
- 2027-2033 Ridgeview Rd
- 2585 Westmont Blvd
- 2615 Northwest Blvd
- 3094 Bembridge Rd
- 3130 Bembridge Rd
- 3107 Halesworth Rd
- 3095 Halesworth Rd
- 3119 Halesworth Rd
- 3111 Bembridge Rd
- 3101 Bembridge Rd
- 3125 Bembridge Rd
- 3082 Bembridge Rd
- 3083 Halesworth Rd
- 3142 Bembridge Rd
- 3131 Halesworth Rd
- 3089 Bembridge Rd
- 3071 Halesworth Rd
- 3070 Bembridge Rd
- 3106 Halesworth Rd
- 3122 Brandon Rd
- 3094 Halesworth Rd
- 3112 Brandon Rd
- 3154 Bembridge Rd