Estimated Value: $214,980 - $257,000
2
Beds
--
Bath
72,150
Sq Ft
$3/Sq Ft
Est. Value
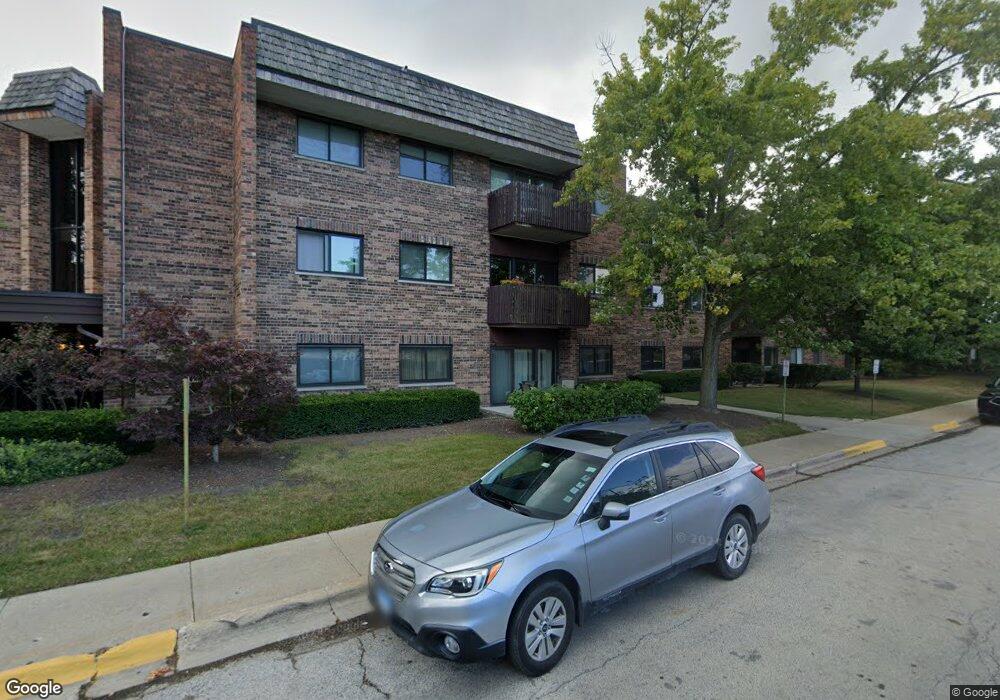
About This Home
This home is located at 3110 Pheasant Creek Dr Unit A, Northbrook, IL 60062 and is currently estimated at $237,745, approximately $3 per square foot. 3110 Pheasant Creek Dr Unit A is a home located in Cook County with nearby schools including Hickory Point Elementary School, Shabonee Elementary School, and Wood Oaks Jr High School.
Ownership History
Date
Name
Owned For
Owner Type
Purchase Details
Closed on
Jun 20, 2006
Sold by
Rogoff Gregory and Rogoff Mira
Bought by
Lerner Irena
Current Estimated Value
Home Financials for this Owner
Home Financials are based on the most recent Mortgage that was taken out on this home.
Original Mortgage
$174,400
Interest Rate
5.87%
Mortgage Type
Unknown
Purchase Details
Closed on
Aug 28, 1997
Sold by
Burke Virginia J and Burke Robert J
Bought by
Rogoff Gregory and Rogoff Mira
Home Financials for this Owner
Home Financials are based on the most recent Mortgage that was taken out on this home.
Original Mortgage
$85,000
Interest Rate
7.57%
Purchase Details
Closed on
Jun 21, 1994
Sold by
Zaveduk Benjamin J
Bought by
Burke Virginia J and Burke Robert J
Create a Home Valuation Report for This Property
The Home Valuation Report is an in-depth analysis detailing your home's value as well as a comparison with similar homes in the area
Home Values in the Area
Average Home Value in this Area
Purchase History
| Date | Buyer | Sale Price | Title Company |
|---|---|---|---|
| Lerner Irena | $218,000 | Multiple | |
| Rogoff Gregory | $79,333 | -- | |
| Burke Virginia J | $113,500 | -- | |
| Zaveduk Adele | -- | Ticor Title Insurance |
Source: Public Records
Mortgage History
| Date | Status | Borrower | Loan Amount |
|---|---|---|---|
| Open | Lerner Irena | $176,895 | |
| Closed | Lerner Irena | $174,400 | |
| Closed | Lerner Irena | $21,800 | |
| Previous Owner | Rogoff Gregory | $85,000 |
Source: Public Records
Tax History Compared to Growth
Tax History
| Year | Tax Paid | Tax Assessment Tax Assessment Total Assessment is a certain percentage of the fair market value that is determined by local assessors to be the total taxable value of land and additions on the property. | Land | Improvement |
|---|---|---|---|---|
| 2024 | $3,819 | $16,372 | $1,026 | $15,346 |
| 2023 | $3,689 | $16,372 | $1,026 | $15,346 |
| 2022 | $3,689 | $16,372 | $1,026 | $15,346 |
| 2021 | $3,221 | $12,723 | $889 | $11,834 |
| 2020 | $3,173 | $12,723 | $889 | $11,834 |
| 2019 | $3,096 | $13,972 | $889 | $13,083 |
| 2018 | $2,530 | $10,496 | $410 | $10,086 |
| 2017 | $2,459 | $10,496 | $410 | $10,086 |
| 2016 | $1,757 | $10,496 | $410 | $10,086 |
| 2015 | $1,441 | $8,525 | $649 | $7,876 |
| 2014 | $1,419 | $8,525 | $649 | $7,876 |
| 2013 | $1,365 | $8,525 | $649 | $7,876 |
Source: Public Records
About This Building
Map
Nearby Homes
- 3110 Pheasant Creek Dr Unit 206
- 3110 Pheasant Creek Dr Unit A
- 3110 Pheasant Creek Dr Unit 101
- 1012 Sussex Dr Unit 1012
- 3070 Pheasant Creek Dr Unit 201
- 3050 Pheasant Creek Dr Unit 301
- 3030 Pheasant Creek Dr Unit 207
- 3030 Pheasant Creek Dr Unit 102
- 2814 Crimson Ct
- 47 The Court of Greenway Unit 121
- 9 the Court of Lagoon View
- 519 Anthony Trail
- 795 Greenwood Rd
- 783 Greenwood Rd
- 25 The Court of Island Point
- 771 Greenwood Rd
- 45 The Court of Cobblestone
- 7 The Court of Muirwood
- 1331 Pfingsten Rd
- 628 Greenwood Rd
- 3110 Pheasant Creek Dr Unit 116
- 3110 Pheasant Creek Dr Unit 318
- 3110 Pheasant Creek Dr Unit 216
- 3110 Pheasant Creek Dr Unit A
- 3110 Pheasant Creek Dr Unit A
- 3110 Pheasant Creek Dr Unit A
- 3110 Pheasant Creek Dr Unit A
- 3110 Pheasant Creek Dr Unit A
- 3110 Pheasant Creek Dr Unit A
- 3110 Pheasant Creek Dr Unit A
- 3110 Pheasant Creek Dr Unit A
- 3110 Pheasant Creek Dr Unit A
- 3110 Pheasant Creek Dr Unit A
- 3110 Pheasant Creek Dr Unit A
- 3110 Pheasant Creek Dr Unit A
- 3110 Pheasant Creek Dr Unit A
- 3110 Pheasant Creek Dr Unit A
- 3110 Pheasant Creek Dr Unit A
- 3110 Pheasant Creek Dr Unit A
- 3110 Pheasant Creek Dr Unit A