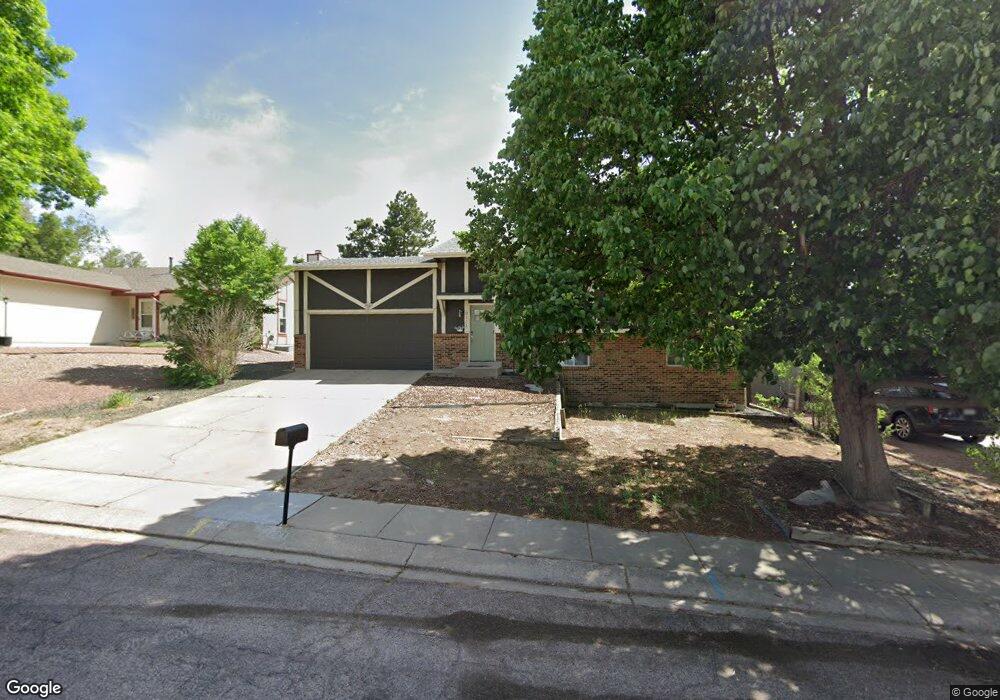
3111 Banjo Dr Colorado Springs, CO 80918
Norwood NeighborhoodEstimated Value: $394,000 - $447,000
2
Beds
2
Baths
970
Sq Ft
$439/Sq Ft
Est. Value
About This Home
This home is located at 3111 Banjo Dr, Colorado Springs, CO 80918 and is currently estimated at $426,005, approximately $439 per square foot. 3111 Banjo Dr is a home located in El Paso County with nearby schools including King Elementary School, Russell Middle School, and Doherty High School.
Ownership History
Date
Name
Owned For
Owner Type
Purchase Details
Closed on
May 30, 2018
Sold by
550Fast Inc
Bought by
Pearns Jackson L and Pearns Christina
Current Estimated Value
Home Financials for this Owner
Home Financials are based on the most recent Mortgage that was taken out on this home.
Original Mortgage
$275,500
Outstanding Balance
$237,723
Interest Rate
4.4%
Mortgage Type
New Conventional
Estimated Equity
$188,282
Purchase Details
Closed on
Nov 29, 2017
Sold by
Scheller Pamela R
Bought by
550 Fast Inc
Purchase Details
Closed on
Jul 2, 1986
Bought by
550Fast Inc
Purchase Details
Closed on
Dec 9, 1982
Bought by
550Fast Inc
Purchase Details
Closed on
Dec 29, 1981
Bought by
550Fast Inc
Purchase Details
Closed on
Jun 24, 1981
Bought by
550Fast Inc
Purchase Details
Closed on
Sep 3, 1980
Bought by
550Fast Inc
Create a Home Valuation Report for This Property
The Home Valuation Report is an in-depth analysis detailing your home's value as well as a comparison with similar homes in the area
Home Values in the Area
Average Home Value in this Area
Purchase History
| Date | Buyer | Sale Price | Title Company |
|---|---|---|---|
| Pearns Jackson L | $293,000 | Heritage Title Co | |
| 550 Fast Inc | $171,800 | Heritage Title Co | |
| 550Fast Inc | -- | -- | |
| 550Fast Inc | -- | -- | |
| 550Fast Inc | -- | -- | |
| 550Fast Inc | -- | -- | |
| 550Fast Inc | -- | -- |
Source: Public Records
Mortgage History
| Date | Status | Borrower | Loan Amount |
|---|---|---|---|
| Open | Pearns Jackson L | $275,500 | |
| Closed | 550 Fast Inc | $0 |
Source: Public Records
Tax History Compared to Growth
Tax History
| Year | Tax Paid | Tax Assessment Tax Assessment Total Assessment is a certain percentage of the fair market value that is determined by local assessors to be the total taxable value of land and additions on the property. | Land | Improvement |
|---|---|---|---|---|
| 2025 | $1,346 | $28,710 | -- | -- |
| 2024 | $1,233 | $28,640 | $5,700 | $22,940 |
| 2022 | $1,184 | $21,150 | $5,060 | $16,090 |
| 2021 | $1,284 | $21,760 | $5,210 | $16,550 |
| 2020 | $1,181 | $17,400 | $4,530 | $12,870 |
| 2019 | $1,175 | $17,400 | $4,530 | $12,870 |
| 2018 | $1,081 | $14,730 | $3,810 | $10,920 |
| 2017 | $523 | $14,730 | $3,810 | $10,920 |
| 2016 | $406 | $14,020 | $3,940 | $10,080 |
| 2015 | $405 | $14,020 | $3,940 | $10,080 |
| 2014 | $383 | $12,740 | $3,890 | $8,850 |
Source: Public Records
Map
Nearby Homes
- 3184 Dublin Blvd
- 3157 Hearthridge Cir
- 3219 Hearthridge Cir Unit 1003
- 3045 Dublin Blvd
- 3223 Hearthridge Cir Unit 1005
- 2970 Banjo Dr
- 3273 Hearthridge Cir Unit 102
- 2940 Purgatory Dr
- 6655 Lange Cir
- 6525 Montarbor Dr
- 6675 Lange Cir
- 6450 Fall River Dr
- 2910 Downhill Dr
- 2860 Purgatory Dr
- 2840 Purgatory Dr
- 6215 Lange Dr
- 6152 Del Paz Dr
- 6028 Copper Mountain Dr
- 2810 Downhill Dr
- 6175 Montarbor Dr