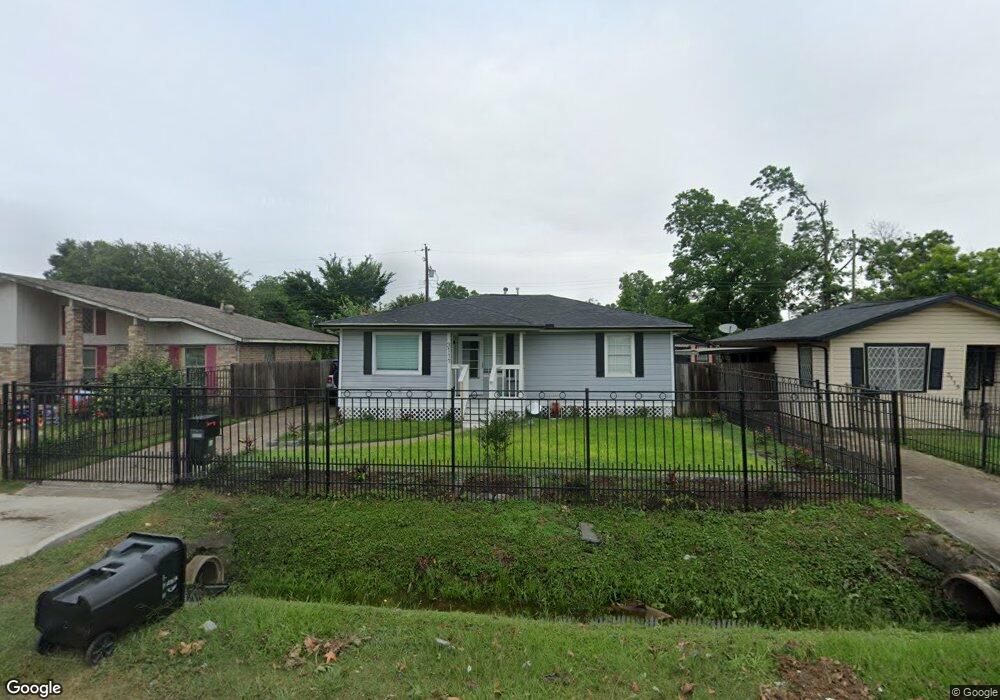
3111 Bennington St Houston, TX 77093
Eastex-Jensen NeighborhoodEstimated Value: $179,000 - $234,000
3
Beds
2
Baths
1,576
Sq Ft
$128/Sq Ft
Est. Value
About This Home
This home is located at 3111 Bennington St, Houston, TX 77093 and is currently estimated at $201,837, approximately $128 per square foot. 3111 Bennington St is a home located in Harris County with nearby schools including Roderick R. Paige Elementary School, Key Middle, and Kashmere High School.
Ownership History
Date
Name
Owned For
Owner Type
Purchase Details
Closed on
Dec 16, 2017
Sold by
Jackson Marcellia Carter and Wahsiongton Laura Lee
Bought by
Jackson Marcella Cartes
Current Estimated Value
Purchase Details
Closed on
Jul 21, 2017
Sold by
Mcclain Danita Arnel Washington
Bought by
Mcclain Kevin De Lloyd
Purchase Details
Closed on
Sep 11, 2006
Sold by
Washington Cedric Morris and Washington Eric Van
Bought by
Mcclain Danita Arnel Washington
Purchase Details
Closed on
May 19, 2000
Sold by
Mcclain Danita
Bought by
Washington C M
Purchase Details
Closed on
Dec 16, 1999
Sold by
Washington Morris
Bought by
Washington C M
Purchase Details
Closed on
Apr 23, 1984
Sold by
Greer Lela Washington
Bought by
Washington Laura Lee and Mcclain Sherrell F
Purchase Details
Closed on
Oct 29, 1975
Sold by
Greer Lela Washington
Bought by
Brady Vernon E and Washington Kervin
Create a Home Valuation Report for This Property
The Home Valuation Report is an in-depth analysis detailing your home's value as well as a comparison with similar homes in the area
Home Values in the Area
Average Home Value in this Area
Purchase History
| Date | Buyer | Sale Price | Title Company |
|---|---|---|---|
| Jackson Marcella Cartes | -- | None Available | |
| Jackson Mareclla Carter | -- | None Available | |
| Mcclain Kevin De Lloyd | -- | None Available | |
| Mcclain Danita Arnel Washington | -- | None Available | |
| Washington C M | -- | -- | |
| Washington C M | -- | -- | |
| Washington Laura Lee | -- | -- | |
| Brady Vernon E | -- | -- |
Source: Public Records
Tax History Compared to Growth
Tax History
| Year | Tax Paid | Tax Assessment Tax Assessment Total Assessment is a certain percentage of the fair market value that is determined by local assessors to be the total taxable value of land and additions on the property. | Land | Improvement |
|---|---|---|---|---|
| 2025 | $2,402 | $166,535 | $62,658 | $103,877 |
| 2024 | $2,402 | $159,273 | $52,215 | $107,058 |
| 2023 | $2,402 | $156,663 | $46,994 | $109,669 |
| 2022 | $2,386 | $123,926 | $31,329 | $92,597 |
| 2021 | $2,296 | $103,871 | $31,329 | $72,542 |
| 2020 | $2,169 | $103,871 | $31,329 | $72,542 |
| 2019 | $2,060 | $112,085 | $20,886 | $91,199 |
| 2018 | $1,873 | $74,012 | $20,886 | $53,126 |
| 2017 | $1,871 | $74,012 | $20,886 | $53,126 |
| 2016 | $1,809 | $71,561 | $13,924 | $57,637 |
| 2015 | $1,300 | $71,561 | $13,924 | $57,637 |
| 2014 | $1,300 | $71,561 | $13,924 | $57,637 |
Source: Public Records
Map
Nearby Homes
- 3210 Oklahoma St
- 6806 Schuller Rd
- 4008 Bennington St
- 2507 Creston Dr
- 3224 Creston Dr
- 2710 Lynnfield St
- 2707 Lynnfield St
- 3425 King St
- 3429 King St
- 3721 Bennington St
- 3016 King St
- 3711 Dorchester St
- 7305 Jensen
- 3401 Melbourne St
- 3810 Lynnfield St
- 3206 Melbourne St
- 3012 Melbourne St
- 0 Dorchester St
- 3818 Lynnfield St
- 2503 Creston Dr
- 3107 Bennington St
- 3115 Bennington St
- 3119 Bennington St
- 3103 Bennington St
- 3110 Oklahoma St
- 3114 Oklahoma St
- 3106 Oklahoma St
- 3123 Bennington St
- 3021 Bennington St
- 3118 Oklahoma St
- 3102 Oklahoma St
- 3203 Bennington St
- 3019 Bennington St
- 3202 Oklahoma St
- 3018 Oklahoma St
- 6807 Brewster St
- 3015 Bennington St
- 3207 Bennington St
- 3014 Oklahoma St
- 3206 Oklahoma St