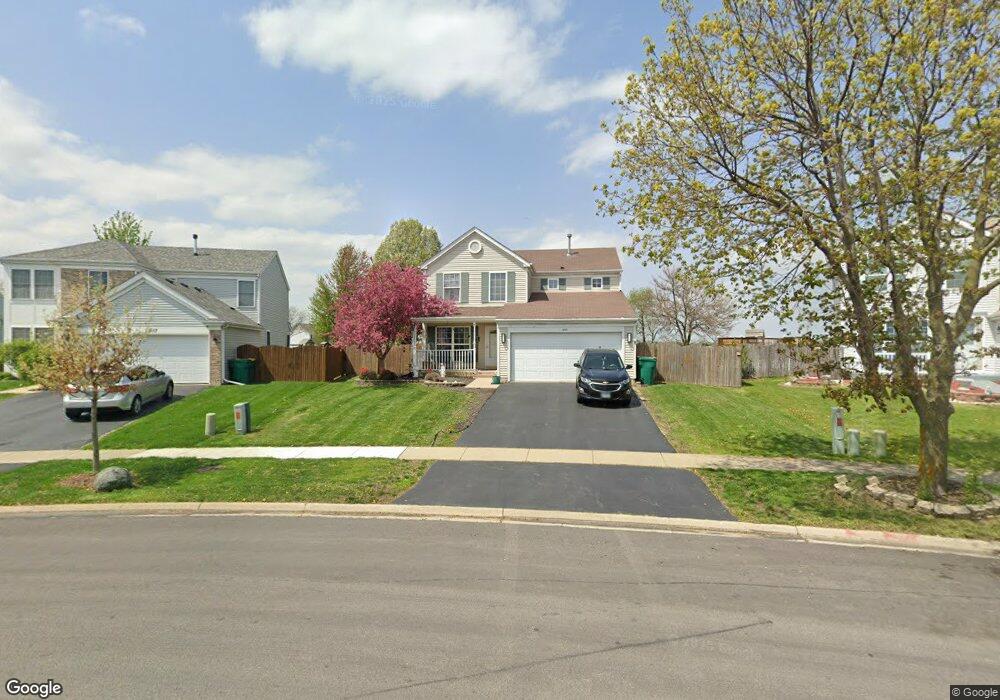
3111 Bloomfield Dr Joliet, IL 60436
Southwest Joliet NeighborhoodEstimated Value: $344,000 - $376,000
3
Beds
3
Baths
1,722
Sq Ft
$205/Sq Ft
Est. Value
About This Home
This home is located at 3111 Bloomfield Dr, Joliet, IL 60436 and is currently estimated at $353,406, approximately $205 per square foot. 3111 Bloomfield Dr is a home located in Will County with nearby schools including Heritage Trail Elementary School, Troy Middle School, and Orenic Intermediate School.
Ownership History
Date
Name
Owned For
Owner Type
Purchase Details
Closed on
Jan 5, 2022
Sold by
Catalani Traci Lyn and Catalani Ashlee N
Bought by
Arredondo Vanessa
Current Estimated Value
Home Financials for this Owner
Home Financials are based on the most recent Mortgage that was taken out on this home.
Original Mortgage
$246,500
Outstanding Balance
$227,594
Interest Rate
3.25%
Mortgage Type
New Conventional
Estimated Equity
$125,812
Purchase Details
Closed on
May 2, 2003
Sold by
Lee Eddie R and Lee Sandra M
Bought by
Salerno Christopher A
Home Financials for this Owner
Home Financials are based on the most recent Mortgage that was taken out on this home.
Original Mortgage
$163,800
Interest Rate
5.87%
Mortgage Type
Purchase Money Mortgage
Purchase Details
Closed on
Nov 29, 2000
Sold by
Springwood Llc
Bought by
Lee Eddie R and Lee Sandra M
Home Financials for this Owner
Home Financials are based on the most recent Mortgage that was taken out on this home.
Original Mortgage
$137,219
Interest Rate
7.7%
Mortgage Type
FHA
Create a Home Valuation Report for This Property
The Home Valuation Report is an in-depth analysis detailing your home's value as well as a comparison with similar homes in the area
Home Values in the Area
Average Home Value in this Area
Purchase History
| Date | Buyer | Sale Price | Title Company |
|---|---|---|---|
| Arredondo Vanessa | $290,000 | Fidelity National Title | |
| Salerno Christopher A | $182,000 | Chicago Title Insurance Comp | |
| Lee Eddie R | $144,500 | -- |
Source: Public Records
Mortgage History
| Date | Status | Borrower | Loan Amount |
|---|---|---|---|
| Open | Arredondo Vanessa | $246,500 | |
| Previous Owner | Salerno Christopher A | $163,800 | |
| Previous Owner | Lee Eddie R | $137,219 |
Source: Public Records
Tax History
| Year | Tax Paid | Tax Assessment Tax Assessment Total Assessment is a certain percentage of the fair market value that is determined by local assessors to be the total taxable value of land and additions on the property. | Land | Improvement |
|---|---|---|---|---|
| 2024 | $8,396 | $103,630 | $17,119 | $86,511 |
| 2023 | $8,396 | $93,109 | $15,381 | $77,728 |
| 2022 | $6,763 | $78,869 | $14,554 | $64,315 |
| 2021 | $6,337 | $74,194 | $13,691 | $60,503 |
| 2020 | $6,091 | $71,464 | $13,292 | $58,172 |
| 2019 | $5,905 | $68,550 | $12,750 | $55,800 |
| 2018 | $5,647 | $64,050 | $12,750 | $51,300 |
| 2017 | $5,405 | $60,500 | $12,750 | $47,750 |
| 2016 | $5,250 | $57,050 | $12,750 | $44,300 |
| 2015 | $4,639 | $53,698 | $11,448 | $42,250 |
| 2014 | $4,639 | $51,248 | $11,448 | $39,800 |
| 2013 | $4,639 | $52,079 | $11,448 | $40,631 |
Source: Public Records
Map
Nearby Homes
- 917 Prairie Path Ln Unit 2
- 1000 Mission Blvd
- 3212 Pioneer Ct Unit 3
- 906 Natoma Ct
- 3349 Longford Dr Unit 2
- 600 Spring Leaf Dr
- 562 Spring Leaf Dr
- 1030 Surrey Ct
- 3223 Karen Ct
- 812 Mulford Ln
- 811 Copley Ln
- 546 Meadow Lily Dr
- 3406 Karen Dr
- 3527 Silver Leaf Dr
- 624 Springwood Dr Unit 15A6
- 2700 Eagle Dr Unit 4
- 2634 Crescenzo Dr Unit B
- 2651 Crescenzo Dr Unit 3
- 182 Saenz Ln Unit 2E
- 2530 Par Four Ct Unit C
- 3109 Bloomfield Dr
- 3113 Bloomfield Dr
- 3107 Bloomfield Dr
- 3115 Bloomfield Dr
- 802 Mission Blvd
- 3105 Bloomfield Dr Unit 3
- 804 Mission Blvd
- 3117 Bloomfield Dr
- 3106 Bloomfield Dr
- 3103 Bloomfield Dr
- 3108 Bloomfield Dr
- 3104 Bloomfield Dr
- 3110 Bloomfield Dr
- 3102 Bloomfield Dr
- 3207 Windsor Ln
- 812 Mission Blvd
- 3100 Bloomfield Dr
- 3021 Bloomfield Dr
- 807 Mission Blvd
- 3105 Arborsedge Dr Unit 1
Your Personal Tour Guide
Ask me questions while you tour the home.