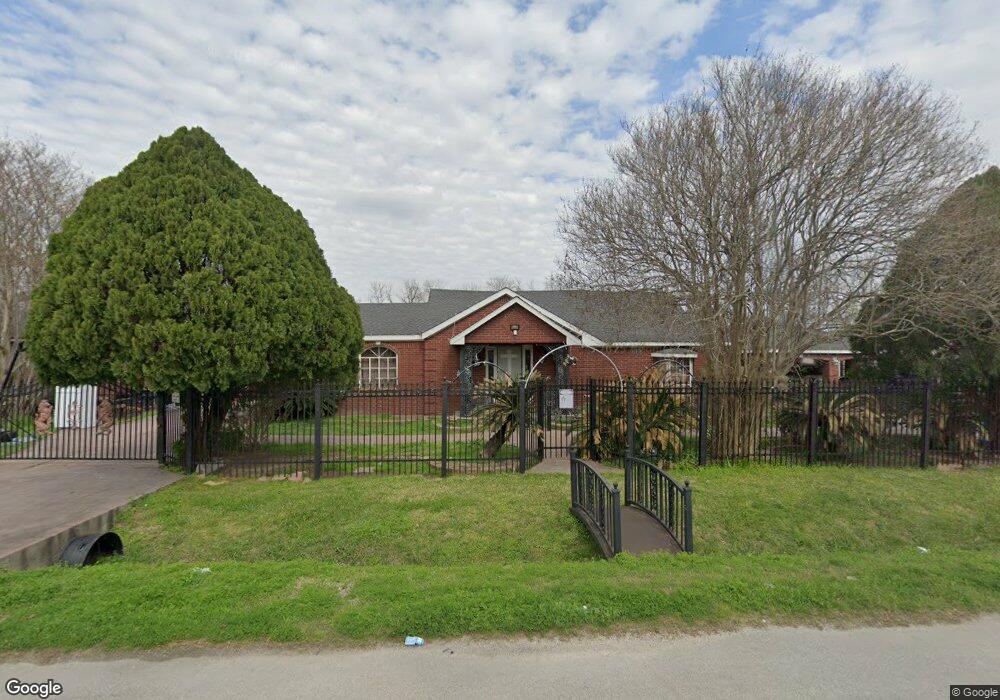
3111 Folger St Houston, TX 77093
Eastex-Jensen NeighborhoodEstimated Value: $268,000 - $352,000
3
Beds
2
Baths
2,178
Sq Ft
$138/Sq Ft
Est. Value
About This Home
This home is located at 3111 Folger St, Houston, TX 77093 and is currently estimated at $299,680, approximately $137 per square foot. 3111 Folger St is a home located in Harris County with nearby schools including Coop Elementary School, Patrick Henry Middle School, and Sam Houston Math, Science & Technology Center.
Ownership History
Date
Name
Owned For
Owner Type
Purchase Details
Closed on
Nov 5, 2021
Sold by
Nash & Angelmira Guerrero Family Trust
Bought by
Ngag Rentals Llc
Current Estimated Value
Purchase Details
Closed on
Aug 2, 2021
Sold by
Guerrero Nash and Guerrero Angelmira
Bought by
Nash & Angelmira Guerrero Family Trust
Purchase Details
Closed on
Dec 6, 2001
Sold by
Johnson Laura L
Bought by
Guerrero Nash and Guerrero Angelmira
Home Financials for this Owner
Home Financials are based on the most recent Mortgage that was taken out on this home.
Original Mortgage
$58,500
Interest Rate
6.41%
Mortgage Type
Credit Line Revolving
Purchase Details
Closed on
Apr 1, 1994
Sold by
Johnson Leura L and Johnson William Hall
Bought by
Dunn Henry Luther and Dunn Maria A
Home Financials for this Owner
Home Financials are based on the most recent Mortgage that was taken out on this home.
Original Mortgage
$26,600
Interest Rate
8.2%
Mortgage Type
Seller Take Back
Create a Home Valuation Report for This Property
The Home Valuation Report is an in-depth analysis detailing your home's value as well as a comparison with similar homes in the area
Home Values in the Area
Average Home Value in this Area
Purchase History
| Date | Buyer | Sale Price | Title Company |
|---|---|---|---|
| Ngag Rentals Llc | -- | None Available | |
| Nash & Angelmira Guerrero Family Trust | -- | None Available | |
| Guerrero Nash | -- | Chicago Title Insurance Co | |
| Dunn Henry Luther | -- | -- |
Source: Public Records
Mortgage History
| Date | Status | Borrower | Loan Amount |
|---|---|---|---|
| Previous Owner | Guerrero Nash | $58,500 | |
| Previous Owner | Dunn Henry Luther | $26,600 |
Source: Public Records
Tax History Compared to Growth
Tax History
| Year | Tax Paid | Tax Assessment Tax Assessment Total Assessment is a certain percentage of the fair market value that is determined by local assessors to be the total taxable value of land and additions on the property. | Land | Improvement |
|---|---|---|---|---|
| 2025 | $5,602 | $343,009 | $135,618 | $207,391 |
| 2024 | $5,602 | $267,732 | $92,941 | $174,791 |
| 2023 | $5,602 | $296,929 | $88,515 | $208,414 |
| 2022 | $4,910 | $223,000 | $63,225 | $159,775 |
| 2021 | $4,767 | $204,539 | $44,258 | $160,281 |
| 2020 | $4,615 | $190,586 | $44,258 | $146,328 |
| 2019 | $4,823 | $190,586 | $44,258 | $146,328 |
| 2018 | $3,787 | $149,662 | $30,348 | $119,314 |
| 2017 | $3,784 | $149,662 | $30,348 | $119,314 |
| 2016 | $3,128 | $123,695 | $30,348 | $93,347 |
| 2015 | $2,734 | $106,345 | $26,555 | $79,790 |
| 2014 | $2,734 | $106,345 | $26,555 | $79,790 |
Source: Public Records
Map
Nearby Homes
- 3202 Parker Rd
- 2633 Hollis St
- 3709 Gager St
- 3302 Sparks St
- 2919 La Estancia Ln
- 3806 Hage St
- 3807 Hage St
- 2318 Cresline St
- 3614 Tidwell Rd
- 3110 Tidwell Rd
- 2415 Goodloe St
- 0.0 Friendly Rd
- 3809 Turner Dr
- 4918 Langley Rd
- 2332 Margaret St
- 4102 Kinkaid St
- 3810 Hurley St
- 9634 Burden St
- 9630 Burden St
- 2315 Langley Rd
- 3115 Folger St
- 3107 Folger St
- 3119 Folger St
- 3015 Folger St
- 3106 Folger St
- 3123 Folger St
- 3102 Folger St
- 3110 Folger St
- 3011 Folger St
- 3114 Folger St
- 3013 Folger St
- 9915 Wages St
- 2919 Folger St
- 3002 Folger St
- 0 Harley Ct Unit 69854383
- 0 Harley Ct Unit 41895340
- 0 Turner Dr Unit 2931354
- 0 Simmons St Unit 82572960
- 0 Turner Dr Unit 88056909
- 0 Manus St Unit 65682299