3111 Hurst Rd SW Conyers, GA 30094
Estimated Value: $349,000 - $404,000
4
Beds
3
Baths
2,550
Sq Ft
$145/Sq Ft
Est. Value
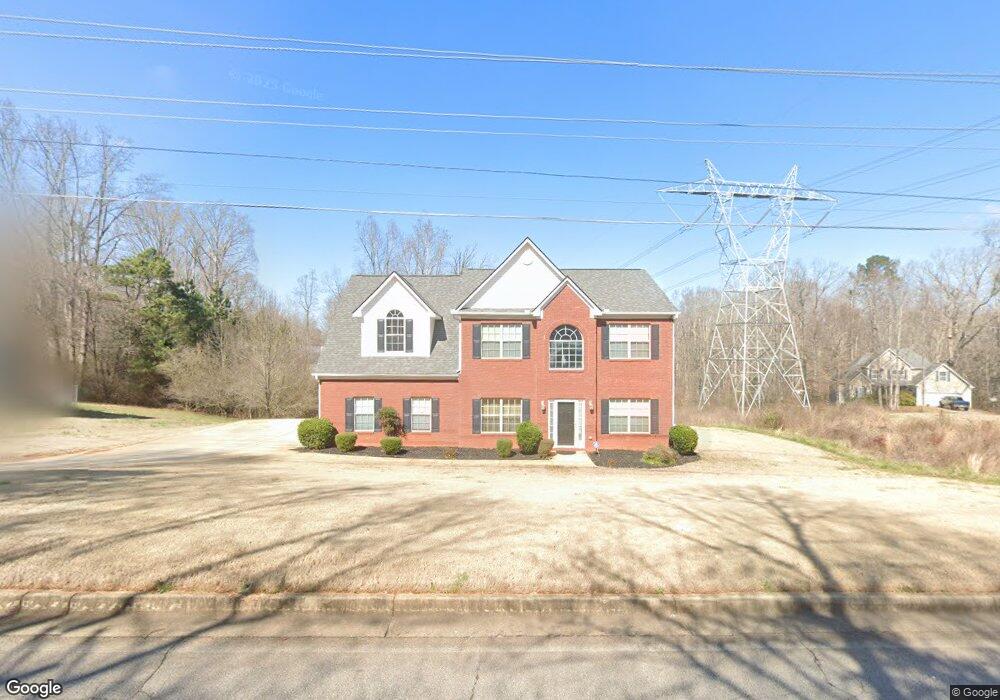
About This Home
This home is located at 3111 Hurst Rd SW, Conyers, GA 30094 and is currently estimated at $370,673, approximately $145 per square foot. 3111 Hurst Rd SW is a home located in Rockdale County with nearby schools including Shoal Creek Elementary School, Gen. Ray Davis Middle School, and Heritage High School.
Ownership History
Date
Name
Owned For
Owner Type
Purchase Details
Closed on
Oct 22, 2008
Sold by
Holmes Charles L
Bought by
Chambers Dewonda
Current Estimated Value
Home Financials for this Owner
Home Financials are based on the most recent Mortgage that was taken out on this home.
Original Mortgage
$173,955
Outstanding Balance
$112,005
Interest Rate
5.78%
Mortgage Type
FHA
Estimated Equity
$258,668
Purchase Details
Closed on
Jul 3, 2008
Sold by
First Nlc Trust 2005-2
Bought by
Holmes Charles L
Home Financials for this Owner
Home Financials are based on the most recent Mortgage that was taken out on this home.
Original Mortgage
$128,000
Interest Rate
6.08%
Purchase Details
Closed on
Nov 6, 2007
Sold by
Ranger Neville
Bought by
First Nlc Trust 2005-2
Purchase Details
Closed on
Feb 6, 2004
Sold by
Five Star Props Gp
Bought by
Cook Donald R
Home Financials for this Owner
Home Financials are based on the most recent Mortgage that was taken out on this home.
Original Mortgage
$156,750
Interest Rate
5.85%
Mortgage Type
New Conventional
Create a Home Valuation Report for This Property
The Home Valuation Report is an in-depth analysis detailing your home's value as well as a comparison with similar homes in the area
Home Values in the Area
Average Home Value in this Area
Purchase History
| Date | Buyer | Sale Price | Title Company |
|---|---|---|---|
| Chambers Dewonda | $174,900 | -- | |
| Holmes Charles L | $109,900 | -- | |
| First Nlc Trust 2005-2 | $166,936 | -- | |
| Cook Donald R | $20,000 | -- |
Source: Public Records
Mortgage History
| Date | Status | Borrower | Loan Amount |
|---|---|---|---|
| Open | Chambers Dewonda | $173,955 | |
| Previous Owner | Holmes Charles L | $128,000 | |
| Previous Owner | Cook Donald R | $156,750 |
Source: Public Records
Tax History Compared to Growth
Tax History
| Year | Tax Paid | Tax Assessment Tax Assessment Total Assessment is a certain percentage of the fair market value that is determined by local assessors to be the total taxable value of land and additions on the property. | Land | Improvement |
|---|---|---|---|---|
| 2024 | $3,488 | $141,960 | $21,360 | $120,600 |
| 2023 | $2,718 | $116,440 | $21,360 | $95,080 |
| 2022 | $2,152 | $94,400 | $18,880 | $75,520 |
| 2021 | $1,806 | $76,480 | $15,880 | $60,600 |
| 2020 | $1,331 | $59,360 | $7,200 | $52,160 |
| 2019 | $1,364 | $59,360 | $7,200 | $52,160 |
| 2018 | $1,373 | $59,360 | $7,200 | $52,160 |
| 2017 | $801 | $40,520 | $5,280 | $35,240 |
| 2016 | $739 | $40,520 | $5,280 | $35,240 |
| 2015 | $741 | $40,520 | $5,280 | $35,240 |
| 2014 | $648 | $39,880 | $4,640 | $35,240 |
| 2013 | -- | $56,840 | $10,480 | $46,360 |
Source: Public Records
Map
Nearby Homes
- 1048 Falls Brooke Dr
- 2923 Hurst Rd SW
- 981 Havenridge Dr SW
- 1240 Falls Creek Ct
- 3190 Water Brook Dr SW
- 3906 Rosebay Way SW
- 1401 Stone Bridge Ln SW
- 1103 W Adrian Cir SW
- 1092 W Adrian Cir SW
- 1087 W Adrian Cir SW
- 4058 Rosebay Way SW
- 1084 W Adrian Cir SW
- 3650 River Rock Rd
- 7225 Bedrock Cir
- 3016 Heights Ave SW
- 3011 Flat Shoals Rd SW
- 1221 Rhodes Walk SW
- 3208 Highpoint Way SW
- 7255 Gladstone Cir
- 3121 Hurst Rd SW
- 3131 Hurst Rd SW Unit 1
- 3101 Hurst Rd SW
- 1101 Falk Trace Unit 2
- 3141 Hurst Rd SW Unit 1
- 1105 Falk Trace
- 1105 Falk Trace Unit 15
- 1100 Falk Trace Unit 2
- 3151 Hurst Rd SW Unit 1
- 3100 Hurst Rd SW
- 3084 Hurst Rd SW
- 1109 Falk Trace
- 3161 Hurst Rd SW Unit 1
- 3074 Hurst Rd SW
- 1108 Falk Trace Unit 2
- 1015 Falls Brooke Dr
- 1113 Falk Trace Unit 2
- 2811 Stone Bridge Trail SW
- 1007 Falls Brooke Dr Unit 1
- 1029 Falls Brooke Dr Unit 2