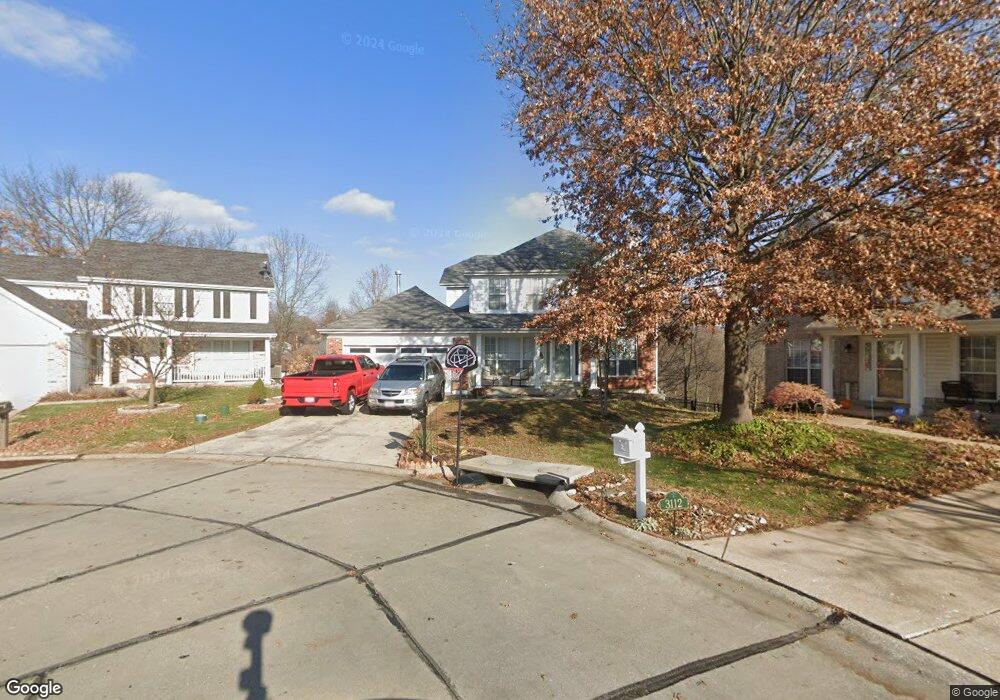
3111 Old Baumgartner Est Ct Saint Louis, MO 63129
Estimated Value: $387,000 - $443,000
4
Beds
3
Baths
2,188
Sq Ft
$190/Sq Ft
Est. Value
About This Home
This home is located at 3111 Old Baumgartner Est Ct, Saint Louis, MO 63129 and is currently estimated at $415,491, approximately $189 per square foot. 3111 Old Baumgartner Est Ct is a home located in St. Louis County with nearby schools including Oakville Elementary School, Bernard Middle School, and Oakville Senior High School.
Ownership History
Date
Name
Owned For
Owner Type
Purchase Details
Closed on
Aug 14, 2020
Sold by
Johnson Kimberly and Johnson Orlando
Bought by
Kelmendi Adem and Kelmendi Gazmend
Current Estimated Value
Purchase Details
Closed on
Dec 2, 2015
Sold by
Staley Veronica M
Bought by
Johnson Kimberly and Johnson Orlando
Home Financials for this Owner
Home Financials are based on the most recent Mortgage that was taken out on this home.
Original Mortgage
$270,697
Interest Rate
3.88%
Mortgage Type
VA
Purchase Details
Closed on
Jun 8, 2005
Sold by
Staley Joseph I
Bought by
Staley Veronica M
Purchase Details
Closed on
Apr 7, 1999
Sold by
Mayer Homes Co
Bought by
Staley Joseph I and Staley Veronica M
Home Financials for this Owner
Home Financials are based on the most recent Mortgage that was taken out on this home.
Original Mortgage
$158,400
Interest Rate
6.89%
Create a Home Valuation Report for This Property
The Home Valuation Report is an in-depth analysis detailing your home's value as well as a comparison with similar homes in the area
Home Values in the Area
Average Home Value in this Area
Purchase History
| Date | Buyer | Sale Price | Title Company |
|---|---|---|---|
| Kelmendi Adem | $275,000 | Title Partners Agency Llc | |
| Johnson Kimberly | $265,000 | Title Partners Agency Llc | |
| Staley Veronica M | -- | -- | |
| Staley Joseph I | $176,000 | -- |
Source: Public Records
Mortgage History
| Date | Status | Borrower | Loan Amount |
|---|---|---|---|
| Previous Owner | Johnson Kimberly | $270,697 | |
| Previous Owner | Staley Joseph I | $158,400 |
Source: Public Records
Tax History Compared to Growth
Tax History
| Year | Tax Paid | Tax Assessment Tax Assessment Total Assessment is a certain percentage of the fair market value that is determined by local assessors to be the total taxable value of land and additions on the property. | Land | Improvement |
|---|---|---|---|---|
| 2025 | $4,363 | $75,470 | $22,380 | $53,090 |
| 2024 | $4,363 | $65,020 | $14,920 | $50,100 |
| 2023 | $4,363 | $65,020 | $14,920 | $50,100 |
| 2022 | $3,778 | $57,290 | $14,920 | $42,370 |
| 2021 | $3,656 | $57,290 | $14,920 | $42,370 |
| 2020 | $3,716 | $55,390 | $12,980 | $42,410 |
| 2019 | $3,705 | $55,390 | $12,980 | $42,410 |
| 2018 | $3,541 | $47,790 | $10,700 | $37,090 |
| 2017 | $3,536 | $47,790 | $10,700 | $37,090 |
| 2016 | $3,469 | $44,980 | $10,700 | $34,280 |
| 2015 | $3,185 | $44,980 | $10,700 | $34,280 |
| 2014 | $2,825 | $39,450 | $19,230 | $20,220 |
Source: Public Records
Map
Nearby Homes
- 2840 Blackforest Dr Unit B
- 5556 Milburn Rd
- 2804 Blackforest Dr Unit A
- 2793 Blackforest Dr Unit B
- 2781 Blackforest Dr Unit C
- 2781 Blackforest Dr Unit B
- 5655 Chalet Hill Dr
- 5581 Baronridge Dr Unit 5
- 5569 Baronridge Dr Unit 10
- 2745 Westphalia Ct Unit C
- 5788 Westphalia Ln Unit 5788
- 5766 Westphalia Ln Unit C
- 5523 Fireleaf Dr
- 2766 Chalet Hill Dr
- 2649 Nahn Dr
- 5457 Mild Dr
- 5445 Mild Dr
- 2711 Windford Ct
- 5908 Oakville Woods Place
- 5810 Flaming Leaf Ct
- 3111 Old Baumgartner Estates Ct
- 3115 Old Baumgartner Est Ct
- 3134 Pin Oak Terrace Ct
- 3112 Old Baumgartner Estates Ct
- 3138 Pin Oak Terrace Ct
- 3130 Pin Oak Terrace Ct
- 3142 Pin Oak Terrace Ct
- 0 Pin Oak Terrace Ct
- 3116 Old Baumgartner Estates Ct
- 3116 Old Baumgartner Est Ct
- 3119 Old Baumgartner Est Ct
- 3119 Old Baumgartner Estates Ct
- 3116 Old Baumgartner Estates Ct
- 3146 Pin Oak Terrace Ct
- 3120 Old Baumgartner Est Ct
- 0 Lot 9 Pin Oak Terrace Addn Unit 90030932
- 3123 Old Baumgartner Est Ct
- 3120 Old Baumgartner Estates Ct
- 3150 Pin Oak Terrace Ct
- 3133 Pin Oak Terrace Ct