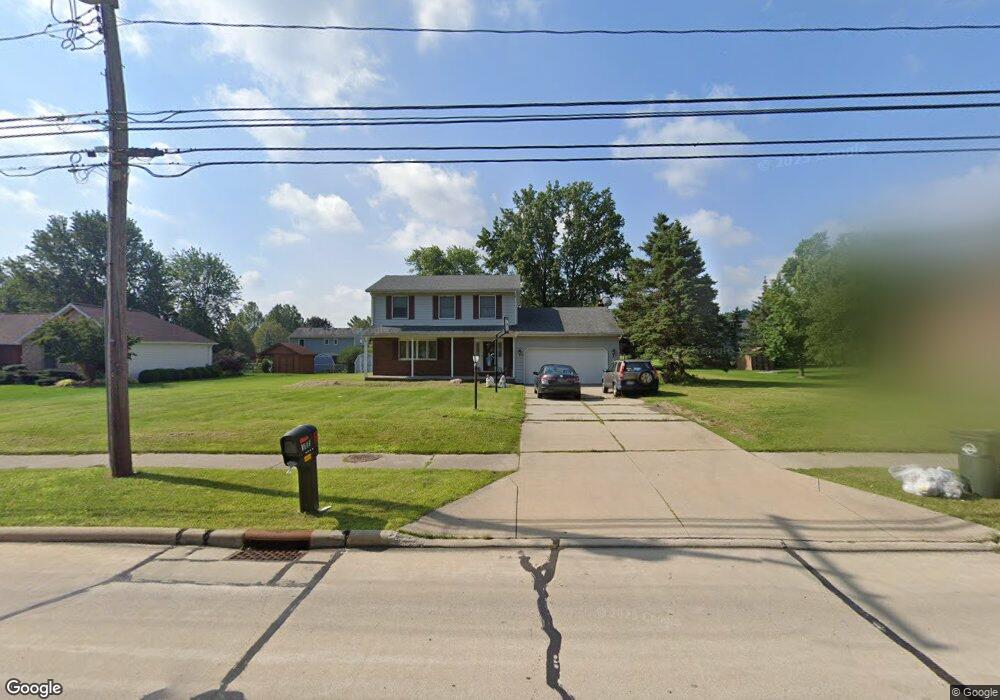
3111 Royalwood Rd North Royalton, OH 44133
Estimated Value: $342,000 - $395,000
3
Beds
3
Baths
1,840
Sq Ft
$200/Sq Ft
Est. Value
About This Home
This home is located at 3111 Royalwood Rd, North Royalton, OH 44133 and is currently estimated at $368,691, approximately $200 per square foot. 3111 Royalwood Rd is a home located in Cuyahoga County with nearby schools including North Royalton Middle School, North Royalton High School, and Saint Albert the Great Roman Catholic School.
Ownership History
Date
Name
Owned For
Owner Type
Purchase Details
Closed on
Aug 24, 2011
Sold by
Youssef Mariam M and Shenouda Aiman
Bought by
Youssef Shenouda Mariam M and Shenouda Aiman
Current Estimated Value
Home Financials for this Owner
Home Financials are based on the most recent Mortgage that was taken out on this home.
Original Mortgage
$113,960
Interest Rate
3.75%
Mortgage Type
FHA
Purchase Details
Closed on
Sep 26, 2002
Sold by
Frank David A and Frank Deborah A
Bought by
Youssef Mariam M
Home Financials for this Owner
Home Financials are based on the most recent Mortgage that was taken out on this home.
Original Mortgage
$128,000
Interest Rate
5.8%
Purchase Details
Closed on
Sep 8, 1988
Bought by
Frank David A
Purchase Details
Closed on
Jan 1, 1988
Bought by
Ohio Savings Assoc
Create a Home Valuation Report for This Property
The Home Valuation Report is an in-depth analysis detailing your home's value as well as a comparison with similar homes in the area
Home Values in the Area
Average Home Value in this Area
Purchase History
| Date | Buyer | Sale Price | Title Company |
|---|---|---|---|
| Youssef Shenouda Mariam M | -- | First Source Title | |
| Youssef Mariam M | $185,000 | Midland Title Security Inc | |
| Frank David A | $28,400 | -- | |
| Ohio Savings Assoc | -- | -- |
Source: Public Records
Mortgage History
| Date | Status | Borrower | Loan Amount |
|---|---|---|---|
| Previous Owner | Youssef Shenouda Mariam M | $113,960 | |
| Previous Owner | Youssef Mariam M | $128,000 |
Source: Public Records
Tax History Compared to Growth
Tax History
| Year | Tax Paid | Tax Assessment Tax Assessment Total Assessment is a certain percentage of the fair market value that is determined by local assessors to be the total taxable value of land and additions on the property. | Land | Improvement |
|---|---|---|---|---|
| 2024 | $5,347 | $101,850 | $21,035 | $80,815 |
| 2023 | $4,516 | $80,470 | $21,140 | $59,330 |
| 2022 | $4,512 | $80,470 | $21,140 | $59,330 |
| 2021 | $4,559 | $80,470 | $21,140 | $59,330 |
| 2020 | $4,055 | $69,370 | $18,240 | $51,140 |
| 2019 | $3,937 | $198,200 | $52,100 | $146,100 |
| 2018 | $3,631 | $69,370 | $18,240 | $51,140 |
| 2017 | $3,759 | $59,750 | $16,170 | $43,580 |
| 2016 | $3,284 | $59,750 | $16,170 | $43,580 |
| 2015 | $4,145 | $59,750 | $16,170 | $43,580 |
| 2014 | $4,145 | $59,750 | $16,170 | $43,580 |
Source: Public Records
Map
Nearby Homes
- 3696 Jupiter Dr
- 11431 Villa Grande Dr
- 11960 Apollo Dr
- 2801 W Royalton Rd
- 3164 Fir Tree Dr
- 2301 W Royalton Rd
- 8677 Scenicview Dr
- 5213 Royalton Rd
- 5299 Whistler Ct
- 9055 Ledge View Terrace
- 9075 Ledge View Terrace
- 9085 Ledge View Terrace
- 9210 Ledge View Terrace
- LUCAS TH Plan at The Ledges
- LIBBY TH Plan at The Ledges
- ABBY TH Plan at The Ledges
- 9125 Ledge View Terrace
- 8586 Northwood Dr
- 9478 Scottsdale Dr
- 4428 Akins Rd
- 3101 Royalwood Rd
- 3121 Royalwood Rd
- 3120 Stoney Creek Dr
- 3110 Stoney Creek Dr
- 3130 Stoney Creek Dr
- 3091 Royalwood Rd
- 3131 Royalwood Rd
- 3100 Stoney Creek Dr
- 3674 Royalwood Rd
- 3140 Stoney Creek Dr
- 3698 Royalwood Rd
- 3081 Royalwood Rd
- 3594 Royalwood Rd
- 3141 Royalwood Rd
- 3090 Stoney Creek Dr
- 12596 Saturn Dr
- 3121 Stoney Creek Dr
- 3071 Royalwood Rd
- 3111 Stoney Creek Dr
- 3131 Stoney Creek Dr