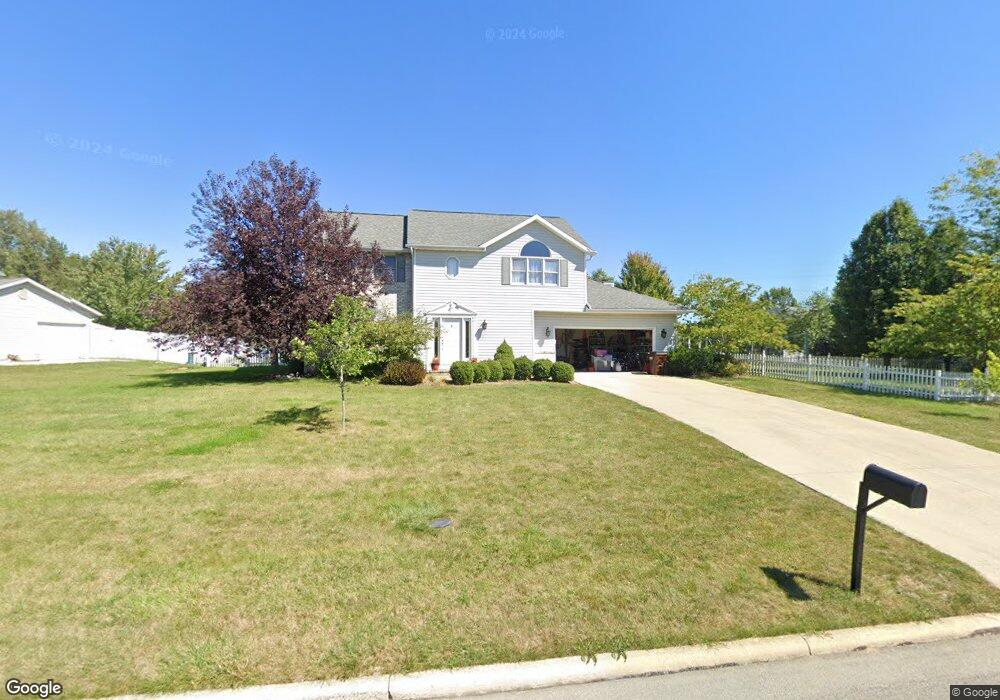
3111 Saddlebrook Findlay, OH 45840
Estimated Value: $427,000 - $452,000
4
Beds
3
Baths
2,318
Sq Ft
$189/Sq Ft
Est. Value
About This Home
This home is located at 3111 Saddlebrook, Findlay, OH 45840 and is currently estimated at $438,396, approximately $189 per square foot. 3111 Saddlebrook is a home located in Hancock County with nearby schools including Liberty-Benton Elementary School, Liberty-Benton Middle School, and Liberty-Benton High School.
Ownership History
Date
Name
Owned For
Owner Type
Purchase Details
Closed on
Apr 12, 2004
Sold by
Hinshaw Wade B and Hinshaw Beth A
Bought by
Steffen James J and Steffen Dyan K
Current Estimated Value
Home Financials for this Owner
Home Financials are based on the most recent Mortgage that was taken out on this home.
Original Mortgage
$164,800
Outstanding Balance
$77,553
Interest Rate
5.66%
Mortgage Type
Purchase Money Mortgage
Estimated Equity
$360,843
Purchase Details
Closed on
Sep 30, 1997
Sold by
Valot Douglas
Bought by
Hinshaw Wade and Hinshaw Beth
Purchase Details
Closed on
Mar 17, 1994
Bought by
Valot Douglas J and Valot Wendy C
Purchase Details
Closed on
Aug 26, 1993
Bought by
Fett Robert
Purchase Details
Closed on
Jul 16, 1992
Bought by
Findlay Hillcrest Golf Crs
Create a Home Valuation Report for This Property
The Home Valuation Report is an in-depth analysis detailing your home's value as well as a comparison with similar homes in the area
Purchase History
| Date | Buyer | Sale Price | Title Company |
|---|---|---|---|
| Steffen James J | $206,000 | Home Title | |
| Hinshaw Wade | $189,900 | -- | |
| Valot Douglas J | $185,500 | -- | |
| Fett Robert | $25,900 | -- | |
| Findlay Hillcrest Golf Crs | -- | -- |
Source: Public Records
Mortgage History
| Date | Status | Borrower | Loan Amount |
|---|---|---|---|
| Open | Steffen James J | $164,800 |
Source: Public Records
Tax History
| Year | Tax Paid | Tax Assessment Tax Assessment Total Assessment is a certain percentage of the fair market value that is determined by local assessors to be the total taxable value of land and additions on the property. | Land | Improvement |
|---|---|---|---|---|
| 2024 | $4,448 | $119,640 | $26,970 | $92,670 |
| 2023 | $4,343 | $119,640 | $26,970 | $92,670 |
| 2022 | $4,300 | $119,640 | $26,970 | $92,670 |
| 2021 | $4,101 | $100,710 | $26,990 | $73,720 |
| 2020 | $4,136 | $100,710 | $26,990 | $73,720 |
| 2019 | $3,968 | $100,710 | $26,990 | $73,720 |
| 2018 | $3,319 | $92,990 | $19,270 | $73,720 |
| 2017 | $1,712 | $92,990 | $19,270 | $73,720 |
| 2016 | $3,319 | $92,990 | $19,270 | $73,720 |
| 2015 | $2,717 | $74,200 | $20,310 | $53,890 |
| 2014 | $2,707 | $73,250 | $20,310 | $52,940 |
| 2012 | $3,005 | $77,860 | $20,310 | $57,550 |
Source: Public Records
Map
Nearby Homes
- 3106 Saddlebrook
- 3018 Gleneagle Dr
- 3237 Gleneagle Dr
- 6535 Silver Lake Dr
- 10321 Wheatfield Dr
- 3815 Forest Trail Dr
- 0 County Road 95 Unit 6097574
- 9894 Smokies Way
- 0 Bushwillow Dr Or Rock Candy Rd Unit Lot 157
- 0 Rock Candy Rd Or Bushwillow Dr Unit Lot 173
- 0 Bearcat Way Or Rock Candy Rd Unit Lot 167
- 0 Rock Candy Rd Unit Lot 159
- 0 Rock Candy Rd Unit Lot 170
- 0 Rock Candy Rd Unit Lot 172 206819
- 0 Rock Candy Rd Unit Lot 162
- 0 Rock Candy Rd Unit Lot 171
- 0 Rock Candy Rd Unit Lot 168
- 925 W Melrose Ave
- 0 Allen Township 142
- 0 Township Highway 99
- 3115 Saddlebrook
- 3018 Pepper Pike
- 3107 Saddlebrook
- 3024 Pepper Pike
- 3014 Pepper Pike
- 3121 Saddlebrook
- 3116 Saddlebrook
- 3100 Pepper Pike
- 1406 Cypress Lake
- 3120 Saddlebrook
- 3101 Saddlebrook
- 3125 Saddlebrook
- 3008 Innisbrook Dr
- 3015 Pepper Pike
- 3010 Pepper Pike
- 3023 Pepper Pike
- 3110 Pepper Pike
- 3124 Saddlebrook
- 1412 Cypress Lake
- 3101 Pepper Pike
Your Personal Tour Guide
Ask me questions while you tour the home.