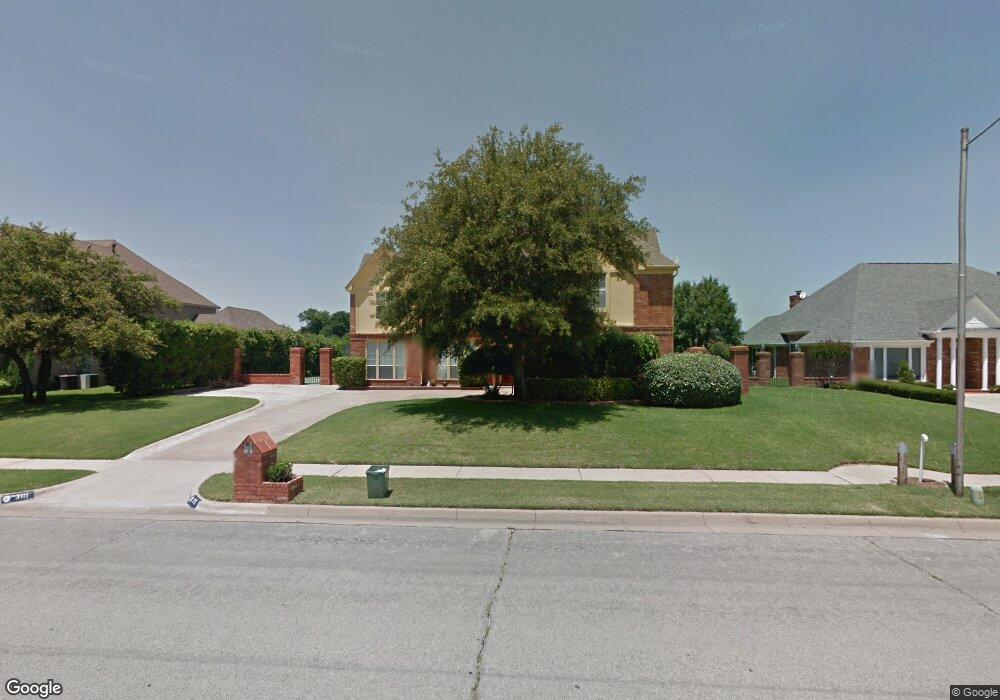
3111 Westwood Dr Arlington, TX 76012
West Arlington NeighborhoodEstimated Value: $616,000 - $746,000
4
Beds
4
Baths
4,360
Sq Ft
$156/Sq Ft
Est. Value
About This Home
This home is located at 3111 Westwood Dr, Arlington, TX 76012 and is currently estimated at $679,514, approximately $155 per square foot. 3111 Westwood Dr is a home located in Tarrant County with nearby schools including Pope Elementary School, Shackelford J High School, and Lamar High School.
Ownership History
Date
Name
Owned For
Owner Type
Purchase Details
Closed on
Sep 15, 2010
Sold by
Federal Home Loan Mortgage Corporation
Bought by
Burger Robert E and Burger Teresa D
Current Estimated Value
Home Financials for this Owner
Home Financials are based on the most recent Mortgage that was taken out on this home.
Original Mortgage
$180,000
Outstanding Balance
$118,497
Interest Rate
4.38%
Mortgage Type
New Conventional
Estimated Equity
$561,017
Purchase Details
Closed on
Mar 9, 2010
Sold by
Citimortgage Inc
Bought by
Federal Home Loan Mortgage Corp
Purchase Details
Closed on
Mar 4, 2010
Sold by
Robinson Thomas
Bought by
Citimortgage Inc
Purchase Details
Closed on
May 9, 2006
Sold by
Best Buy Realty
Bought by
Robinson Thomas V
Purchase Details
Closed on
May 26, 2000
Sold by
Williams James A and Williams Elvina D
Bought by
Robinson Thomas
Home Financials for this Owner
Home Financials are based on the most recent Mortgage that was taken out on this home.
Original Mortgage
$229,600
Interest Rate
10.8%
Create a Home Valuation Report for This Property
The Home Valuation Report is an in-depth analysis detailing your home's value as well as a comparison with similar homes in the area
Home Values in the Area
Average Home Value in this Area
Purchase History
| Date | Buyer | Sale Price | Title Company |
|---|---|---|---|
| Burger Robert E | -- | Fatco | |
| Federal Home Loan Mortgage Corp | -- | None Available | |
| Citimortgage Inc | $253,574 | None Available | |
| Robinson Thomas V | -- | None Available | |
| Robinson Thomas | -- | Stewart Title |
Source: Public Records
Mortgage History
| Date | Status | Borrower | Loan Amount |
|---|---|---|---|
| Open | Burger Robert E | $180,000 | |
| Previous Owner | Robinson Thomas | $229,600 |
Source: Public Records
Tax History Compared to Growth
Tax History
| Year | Tax Paid | Tax Assessment Tax Assessment Total Assessment is a certain percentage of the fair market value that is determined by local assessors to be the total taxable value of land and additions on the property. | Land | Improvement |
|---|---|---|---|---|
| 2025 | $10,939 | $625,000 | $103,275 | $521,725 |
| 2024 | $10,939 | $705,715 | $103,275 | $602,440 |
| 2023 | $12,136 | $550,000 | $103,275 | $446,725 |
| 2022 | $12,441 | $504,300 | $103,275 | $401,025 |
| 2021 | $11,815 | $454,737 | $91,800 | $362,937 |
| 2020 | $10,673 | $425,000 | $91,800 | $333,200 |
| 2019 | $11,041 | $425,000 | $82,586 | $342,414 |
| 2018 | $9,500 | $398,320 | $45,900 | $352,420 |
| 2017 | $10,466 | $431,371 | $54,000 | $377,371 |
| 2016 | $9,515 | $361,420 | $54,000 | $307,420 |
| 2015 | $7,484 | $325,000 | $54,000 | $271,000 |
| 2014 | $7,484 | $325,000 | $54,000 | $271,000 |
Source: Public Records
Map
Nearby Homes
- 1420 Porto Bello Ct
- 3136 Watercress Cir
- 3107 Watercress Cir
- 1104 Portofino Ct
- 1529 Woodford Place
- 1405 Blackhill Ct
- 1103 Findlay Dr
- 1006 Portofino Dr
- 8542 Meadowbrook Dr
- 2109 Greta Ln
- 1463 Meadowood Village Dr
- 8617 Keeneland Dr
- 1005 Acorn Ct
- 1424 Meadowood Village Dr
- 1420 Meadowood Village Dr
- 900 Crowley Rd
- 905 Live Oak Ln
- 1306 Riverview Dr
- 2804 Oak Cliff Ln
- 1908 Augustus Dr
- 3113 Westwood Dr
- 3107 Westwood Dr
- 3115 Westwood Dr
- 3105 Westwood Dr
- 3110 Westwood Dr
- 3112 Westwood Dr
- 3117 Westwood Dr
- 3108 Westwood Dr
- 3114 Westwood Dr
- 3106 Westwood Dr
- 3103 Westwood Dr
- 3116 Westwood Dr
- 3104 Westwood Dr
- 1412 Porto Bello Ct
- 3101 Westwood Dr
- 1410 Porto Bello Ct
- 1416 Porto Bello Ct
- 3118 Westwood Dr
- 3102 Westwood Dr
- 1408 Porto Bello Ct