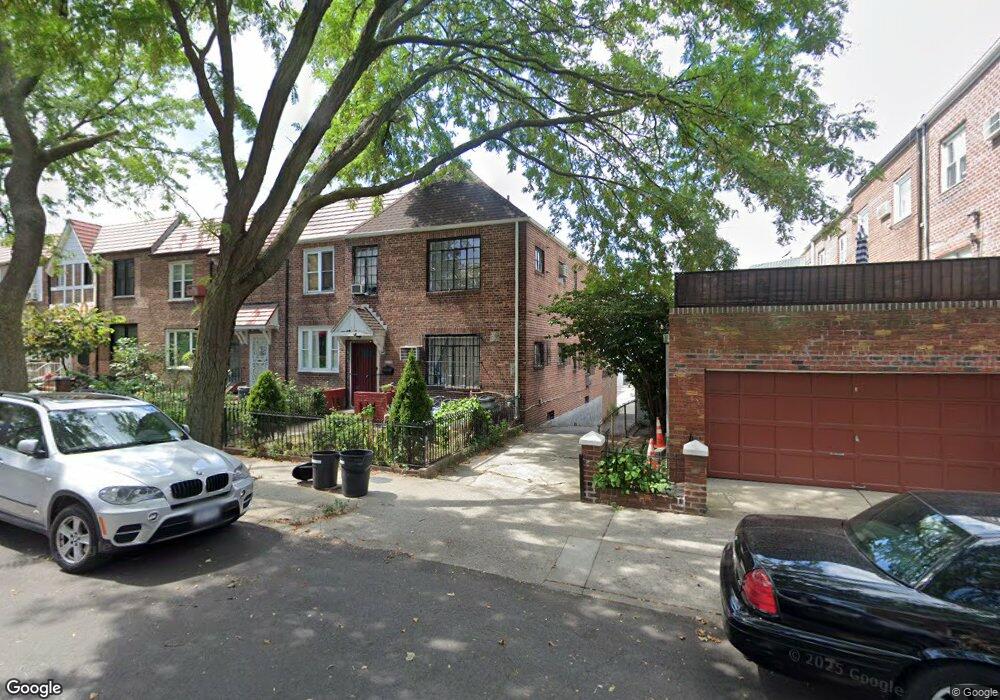
3112 77th St East Elmhurst, NY 11370
Jackson Heights NeighborhoodEstimated Value: $941,000 - $1,116,000
--
Bed
--
Bath
1,680
Sq Ft
$624/Sq Ft
Est. Value
About This Home
This home is located at 3112 77th St, East Elmhurst, NY 11370 and is currently estimated at $1,047,853, approximately $623 per square foot. 3112 77th St is a home located in Queens County with nearby schools including P.S. 212, I.S. 230, and William Cullen Bryant High School.
Ownership History
Date
Name
Owned For
Owner Type
Purchase Details
Closed on
Dec 13, 2022
Sold by
Caamano Nury
Bought by
31-12 77 St Llc
Current Estimated Value
Purchase Details
Closed on
Jan 30, 1998
Sold by
Caamano Jose and Caamano Nury
Bought by
Caamano Nury
Home Financials for this Owner
Home Financials are based on the most recent Mortgage that was taken out on this home.
Original Mortgage
$35,712
Interest Rate
7.05%
Create a Home Valuation Report for This Property
The Home Valuation Report is an in-depth analysis detailing your home's value as well as a comparison with similar homes in the area
Home Values in the Area
Average Home Value in this Area
Purchase History
| Date | Buyer | Sale Price | Title Company |
|---|---|---|---|
| 31-12 77 St Llc | $750,000 | -- | |
| 31-12 77 St Llc | $750,000 | -- | |
| 31-12 77 St Llc | $750,000 | -- | |
| Caamano Nury | -- | Stewart Title Insurance Co | |
| Caamano Nury | -- | Stewart Title Insurance Co |
Source: Public Records
Mortgage History
| Date | Status | Borrower | Loan Amount |
|---|---|---|---|
| Previous Owner | Caamano Nury | $35,712 |
Source: Public Records
Tax History Compared to Growth
Tax History
| Year | Tax Paid | Tax Assessment Tax Assessment Total Assessment is a certain percentage of the fair market value that is determined by local assessors to be the total taxable value of land and additions on the property. | Land | Improvement |
|---|---|---|---|---|
| 2025 | $8,796 | $46,420 | $10,684 | $35,736 |
| 2024 | $8,796 | $43,793 | $10,171 | $33,622 |
| 2023 | $8,894 | $43,793 | $8,867 | $34,926 |
| 2022 | $8,677 | $63,600 | $13,740 | $49,860 |
| 2021 | $8,629 | $56,760 | $13,740 | $43,020 |
| 2020 | $8,188 | $52,140 | $13,740 | $38,400 |
| 2019 | $7,634 | $51,600 | $13,740 | $37,860 |
| 2018 | $7,439 | $36,494 | $10,057 | $26,437 |
| 2017 | $7,383 | $36,219 | $10,066 | $26,153 |
| 2016 | $6,831 | $36,219 | $10,066 | $26,153 |
| 2015 | $3,901 | $32,236 | $12,331 | $19,905 |
| 2014 | $3,901 | $30,412 | $11,211 | $19,201 |
Source: Public Records
Map
Nearby Homes