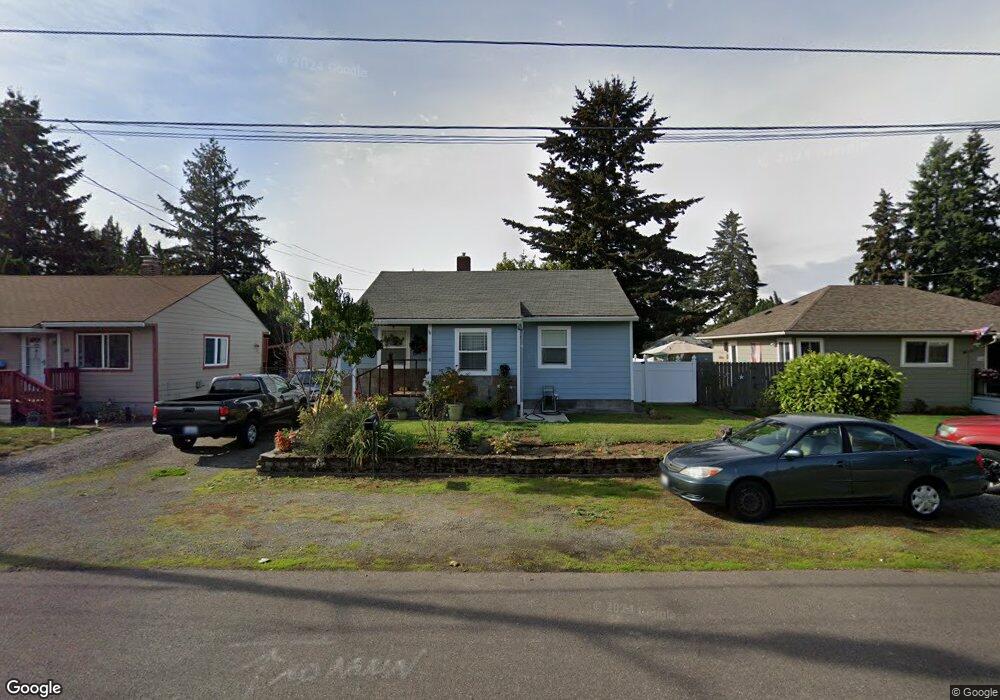
3112 Weigel Ave Vancouver, WA 98660
Fruit Valley NeighborhoodEstimated Value: $392,000 - $438,993
2
Beds
2
Baths
1,665
Sq Ft
$248/Sq Ft
Est. Value
About This Home
This home is located at 3112 Weigel Ave, Vancouver, WA 98660 and is currently estimated at $412,998, approximately $248 per square foot. 3112 Weigel Ave is a home located in Clark County with nearby schools including Fruit Valley Elementary School, Discovery Middle School, and Hudson's Bay High School.
Ownership History
Date
Name
Owned For
Owner Type
Purchase Details
Closed on
Dec 24, 2001
Sold by
Garcia Sergio
Bought by
Cisneros Jamie Garcia
Current Estimated Value
Purchase Details
Closed on
Sep 22, 1998
Sold by
Zamilpa Andrea
Bought by
Cisneros Jaime Garcia
Purchase Details
Closed on
Jun 17, 1998
Sold by
Wood David G and Wood Gloria V
Bought by
Cisneros Jaime Garcia and Garcia Sergio
Home Financials for this Owner
Home Financials are based on the most recent Mortgage that was taken out on this home.
Original Mortgage
$91,667
Interest Rate
6.88%
Mortgage Type
FHA
Create a Home Valuation Report for This Property
The Home Valuation Report is an in-depth analysis detailing your home's value as well as a comparison with similar homes in the area
Home Values in the Area
Average Home Value in this Area
Purchase History
| Date | Buyer | Sale Price | Title Company |
|---|---|---|---|
| Cisneros Jamie Garcia | -- | -- | |
| Cisneros Jaime Garcia | -- | Chicago Title Insurance Co | |
| Cisneros Jaime Garcia | $92,000 | Chicago Title Insurance Co |
Source: Public Records
Mortgage History
| Date | Status | Borrower | Loan Amount |
|---|---|---|---|
| Previous Owner | Cisneros Jaime Garcia | $91,667 |
Source: Public Records
Tax History Compared to Growth
Tax History
| Year | Tax Paid | Tax Assessment Tax Assessment Total Assessment is a certain percentage of the fair market value that is determined by local assessors to be the total taxable value of land and additions on the property. | Land | Improvement |
|---|---|---|---|---|
| 2025 | $3,803 | $383,710 | $164,030 | $219,680 |
| 2024 | $3,731 | $389,251 | $164,030 | $225,221 |
| 2023 | $3,695 | $401,506 | $169,686 | $231,820 |
| 2022 | $3,415 | $396,384 | $164,030 | $232,354 |
| 2021 | $3,378 | $341,344 | $141,405 | $199,939 |
| 2020 | $3,026 | $318,286 | $139,372 | $178,914 |
| 2019 | $2,845 | $295,439 | $118,466 | $176,973 |
| 2018 | $2,716 | $287,649 | $0 | $0 |
| 2017 | $2,293 | $227,974 | $0 | $0 |
| 2016 | $2,154 | $200,879 | $0 | $0 |
| 2015 | $1,842 | $180,288 | $0 | $0 |
| 2014 | -- | $145,748 | $0 | $0 |
| 2013 | -- | $118,551 | $0 | $0 |
Source: Public Records
Map
Nearby Homes
- 3403 Xavier Ave
- 2807 van Allman Ave
- 2709 Weigel Ave
- 1911 W 37th St
- 3600 Thompson Ave
- 3711 Thompson Ave
- 2216 Thompson Ave
- 1115 W 33rd Way
- 1106 W 30th St
- 3811 Rose Ct
- 3815 Rose Ct
- 2413 Markle Ave
- 708 W Fourth Plain Blvd
- 709 W Fourth Plain Blvd
- 2100 Kauffman Ave
- 2117 Kauffman Ave
- 1204 W Mcloughlin Blvd
- 501 W 30th St
- 1200 W Mcloughlin Blvd
- 2000 Kauffman Ave
- 3110 Weigel Ave
- 3114 Weigel Ave
- 3115 Xavier Ave
- 3108 Weigel Ave
- 3113 Xavier Ave
- 3111 Xavier Ave
- 3116 Weigel Ave
- 3117 Xavier Ave
- 3106 Weigel Ave
- 3203 Xavier Ave
- 3111 Weigel Ave
- 3109 Xavier Ave
- 3109 Weigel Ave
- 3202 Weigel Ave
- 3116 van Allman Ave
- 3104 Weigel Ave
- 3205 Xavier Ave
- 3107 Xavier Ave
- 3204 Weigel Ave
- 3105 Weigel Ave