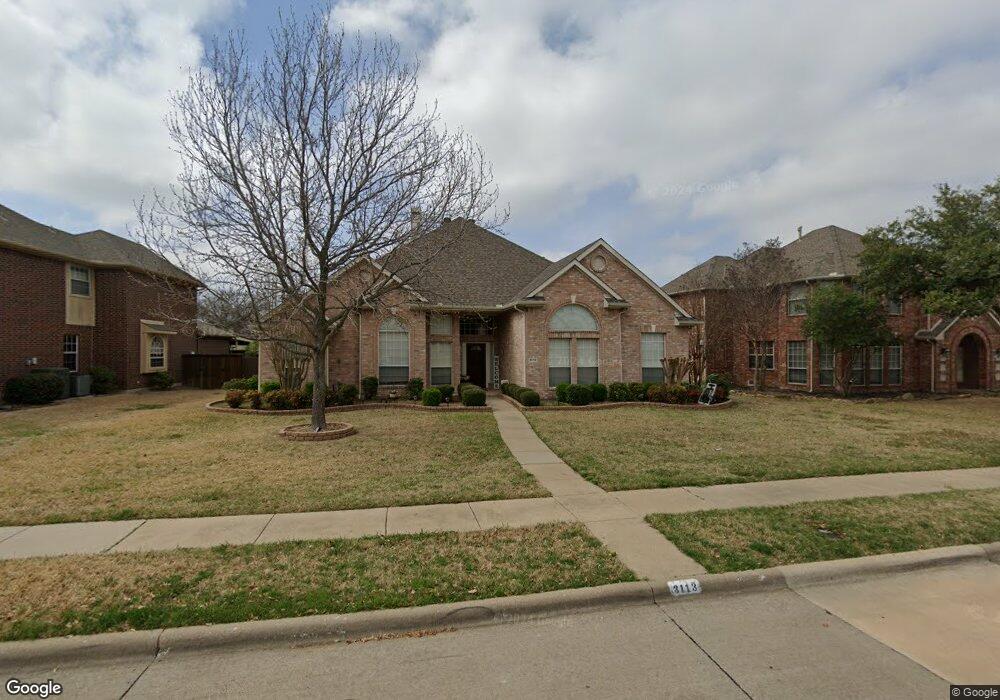
3113 Lincolnshire Dr Richardson, TX 75082
Breckinridge NeighborhoodEstimated Value: $525,545 - $559,000
4
Beds
3
Baths
2,708
Sq Ft
$201/Sq Ft
Est. Value
About This Home
This home is located at 3113 Lincolnshire Dr, Richardson, TX 75082 and is currently estimated at $544,386, approximately $201 per square foot. 3113 Lincolnshire Dr is a home located in Collin County with nearby schools including Miller Elementary School, Murphy Middle School, and C A Mcmillen High School.
Ownership History
Date
Name
Owned For
Owner Type
Purchase Details
Closed on
Aug 13, 2012
Sold by
Kazi Reza and Kazi Sakina
Bought by
Abdoh Haroon R and Enaya Maysaa A
Current Estimated Value
Home Financials for this Owner
Home Financials are based on the most recent Mortgage that was taken out on this home.
Original Mortgage
$214,200
Outstanding Balance
$139,984
Interest Rate
2.5%
Mortgage Type
New Conventional
Estimated Equity
$404,402
Purchase Details
Closed on
Jan 27, 1998
Sold by
Masood Khalid and Masood Munaza S
Bought by
Kazi Reza and Kazi Sakina
Home Financials for this Owner
Home Financials are based on the most recent Mortgage that was taken out on this home.
Original Mortgage
$139,200
Interest Rate
6.98%
Purchase Details
Closed on
Aug 22, 1997
Sold by
Centex International Inc
Bought by
Masood Khalid and Masood Munaza S
Home Financials for this Owner
Home Financials are based on the most recent Mortgage that was taken out on this home.
Original Mortgage
$135,000
Interest Rate
7.46%
Create a Home Valuation Report for This Property
The Home Valuation Report is an in-depth analysis detailing your home's value as well as a comparison with similar homes in the area
Home Values in the Area
Average Home Value in this Area
Purchase History
| Date | Buyer | Sale Price | Title Company |
|---|---|---|---|
| Abdoh Haroon R | -- | Adobe Title | |
| Kazi Reza | -- | -- | |
| Masood Khalid | -- | -- |
Source: Public Records
Mortgage History
| Date | Status | Borrower | Loan Amount |
|---|---|---|---|
| Open | Abdoh Haroon R | $214,200 | |
| Previous Owner | Kazi Reza | $139,200 | |
| Previous Owner | Masood Khalid | $135,000 | |
| Closed | Kazi Reza | $17,400 |
Source: Public Records
Tax History Compared to Growth
Tax History
| Year | Tax Paid | Tax Assessment Tax Assessment Total Assessment is a certain percentage of the fair market value that is determined by local assessors to be the total taxable value of land and additions on the property. | Land | Improvement |
|---|---|---|---|---|
| 2025 | $8,177 | $523,493 | $150,000 | $373,493 |
| 2024 | $8,177 | $514,607 | $125,000 | $389,607 |
| 2023 | $8,177 | $502,287 | $125,000 | $377,287 |
| 2022 | $9,240 | $449,759 | $120,000 | $329,759 |
| 2021 | $7,920 | $362,422 | $90,000 | $272,422 |
| 2020 | $7,613 | $343,142 | $80,000 | $263,142 |
| 2019 | $7,849 | $337,436 | $80,000 | $257,436 |
| 2018 | $7,757 | $332,015 | $80,000 | $252,015 |
| 2017 | $7,048 | $301,666 | $70,000 | $231,666 |
| 2016 | $6,520 | $277,000 | $60,000 | $217,000 |
| 2015 | $5,749 | $252,109 | $60,000 | $192,109 |
Source: Public Records
Map
Nearby Homes
- 5517 Enfield Dr
- 3041 Hillingdon Dr
- 2988 Hillingdon Dr
- 3203 Grantham Dr
- 3309 Grantham Dr
- 2720 Ranchview Dr
- 18 Kilchurn
- 3624 Connaught Rd
- 179 Moonlight Dr
- 3613 Gloucester Rd
- 403 Pleasant Run
- 1201 Tralee Ln
- 5413 Carrington Dr
- 4821 Ravendale Dr
- 524 Jasmine Dr
- 1001 Lochness Ln
- 2525 E Brand Rd
- 4804 Appleridge Dr
- 7022 Cottonwood Cir
- 5421 Palace Dr
- 3111 Lincolnshire Dr
- 3115 Lincolnshire Dr
- 3109 Lincolnshire Dr
- 5602 Baskerville Dr
- 3117 Lincolnshire Dr
- 5601 Baskerville Dr
- 5603 Maidstone Dr
- 3107 Lincolnshire Dr
- 5604 Baskerville Dr
- 3106 Kingston Dr
- 3108 Kingston Dr
- 3104 Kingston Dr
- 5603 Baskerville Dr
- 5605 Maidstone Dr
- 3110 Kingston Dr
- 3105 Lincolnshire Dr
- 5606 Baskerville Dr
- 3102 Kingston Dr
- 5602 Maidstone Dr
- 5605 Baskerville Dr