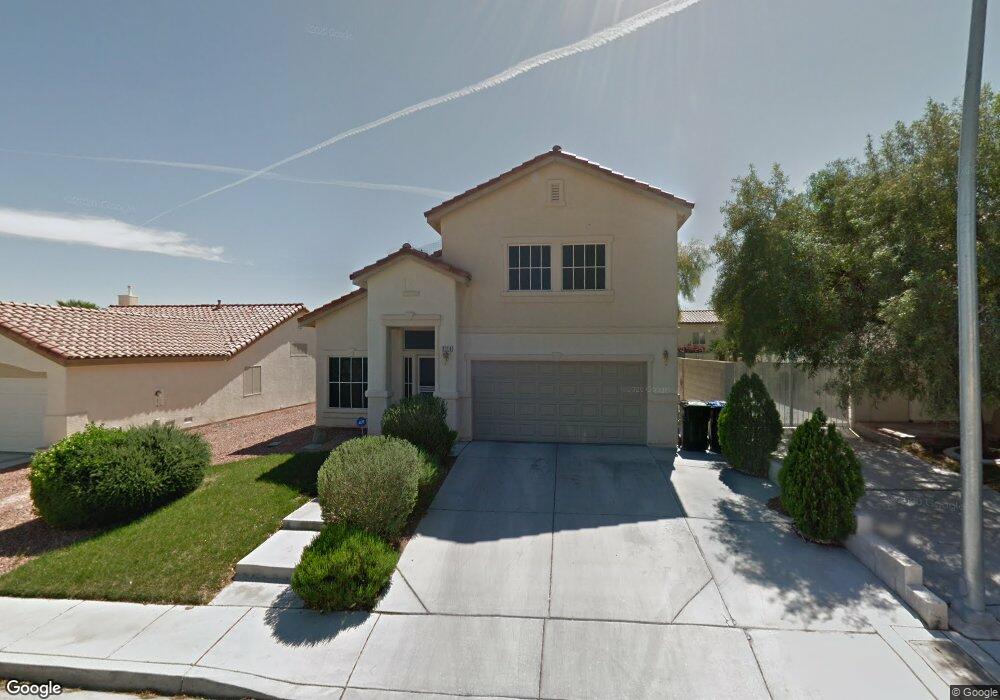
3113 Mastercraft Ave North Las Vegas, NV 89031
Craig Ranch NeighborhoodEstimated Value: $376,000 - $421,000
3
Beds
3
Baths
1,630
Sq Ft
$243/Sq Ft
Est. Value
About This Home
This home is located at 3113 Mastercraft Ave, North Las Vegas, NV 89031 and is currently estimated at $396,602, approximately $243 per square foot. 3113 Mastercraft Ave is a home located in Clark County with nearby schools including Eva G. Simmons Elementary School, Brian & Teri Cram Middle School, and Legacy High School.
Ownership History
Date
Name
Owned For
Owner Type
Purchase Details
Closed on
Apr 4, 2012
Sold by
Gebbert Amy M and Gebbert Aaron C
Bought by
Mabry Elizabeth Jane
Current Estimated Value
Home Financials for this Owner
Home Financials are based on the most recent Mortgage that was taken out on this home.
Original Mortgage
$87,718
Outstanding Balance
$60,128
Interest Rate
3.75%
Mortgage Type
FHA
Estimated Equity
$336,474
Purchase Details
Closed on
Jun 16, 2005
Sold by
Clark Bryan and Clark Holly
Bought by
Gebbert Aaron C and Gebbert Amy M
Home Financials for this Owner
Home Financials are based on the most recent Mortgage that was taken out on this home.
Original Mortgage
$272,000
Interest Rate
3.87%
Mortgage Type
Negative Amortization
Purchase Details
Closed on
Nov 21, 2000
Sold by
Somerset Sfr Llc
Bought by
Clark Bryan and Clark Holly
Home Financials for this Owner
Home Financials are based on the most recent Mortgage that was taken out on this home.
Original Mortgage
$131,387
Interest Rate
7.09%
Mortgage Type
FHA
Create a Home Valuation Report for This Property
The Home Valuation Report is an in-depth analysis detailing your home's value as well as a comparison with similar homes in the area
Home Values in the Area
Average Home Value in this Area
Purchase History
| Date | Buyer | Sale Price | Title Company |
|---|---|---|---|
| Mabry Elizabeth Jane | $90,000 | First American Title Paseo | |
| Gebbert Aaron C | $272,000 | Equity Title Company | |
| Clark Bryan | $133,450 | United Title |
Source: Public Records
Mortgage History
| Date | Status | Borrower | Loan Amount |
|---|---|---|---|
| Open | Mabry Elizabeth Jane | $87,718 | |
| Previous Owner | Gebbert Aaron C | $272,000 | |
| Previous Owner | Clark Bryan | $131,387 | |
| Closed | Clark Bryan | $131,387 |
Source: Public Records
Tax History Compared to Growth
Tax History
| Year | Tax Paid | Tax Assessment Tax Assessment Total Assessment is a certain percentage of the fair market value that is determined by local assessors to be the total taxable value of land and additions on the property. | Land | Improvement |
|---|---|---|---|---|
| 2025 | $1,366 | $94,495 | $32,900 | $61,595 |
| 2024 | $1,326 | $94,495 | $32,900 | $61,595 |
| 2023 | $1,082 | $90,547 | $32,200 | $58,347 |
| 2022 | $1,288 | $79,909 | $26,600 | $53,309 |
| 2021 | $1,250 | $72,086 | $21,350 | $50,736 |
| 2020 | $1,211 | $72,391 | $22,050 | $50,341 |
| 2019 | $1,176 | $68,401 | $18,900 | $49,501 |
| 2018 | $1,142 | $62,809 | $15,400 | $47,409 |
| 2017 | $2,045 | $60,962 | $12,950 | $48,012 |
| 2016 | $1,082 | $51,445 | $8,750 | $42,695 |
| 2015 | $1,079 | $38,224 | $7,000 | $31,224 |
| 2014 | $1,047 | $32,157 | $7,700 | $24,457 |
Source: Public Records
Map
Nearby Homes
- 3114 Mastercraft Ave
- 3217 Palladio Ave
- 3106 Saleen Ct
- 6032 Glitter Gold Ct
- 6140 Passionate Ct
- 3405 Red Fire Ave
- 3217 Bonassola Ave
- 3513 Mastercraft Ave
- 3509 Red Fire Ave
- 5930 Abyss Ct
- 3517 Amish Ave
- 3605 Sapphire Sea Ct
- 3604 Sandy Brown Ave
- 2716 Orchid Moon Ct
- 3221 Villa Pisani Ct
- 2426 Inlet Beach Ct
- 6103 Harvest Dance St
- 2608 Prospector Mine Ave
- 3021 New Journey Way
- 3304 W El Campo Grande Ave
- 3109 Mastercraft Ave
- 3117 Mastercraft Ave
- 3114 Crownline Ct
- 3121 Mastercraft Ave
- 3105 Mastercraft Ave
- 3110 Crownline Ct
- 3118 Crownline Ct
- 3106 Crownline Ct
- 3122 Crownline Ct
- 3118 Mastercraft Ave Unit II
- 3110 Mastercraft Ave
- 3201 Mastercraft Ave
- 3122 Mastercraft Ave
- 3106 Mastercraft Ave
- 3126 Crownline Ct
- 3126 Crownline Ct
- 3205 Mastercraft Ave
- 3205 Mastercraft Ave Unit N
- 3202 Mastercraft Ave
- 3102 Mastercraft Ave