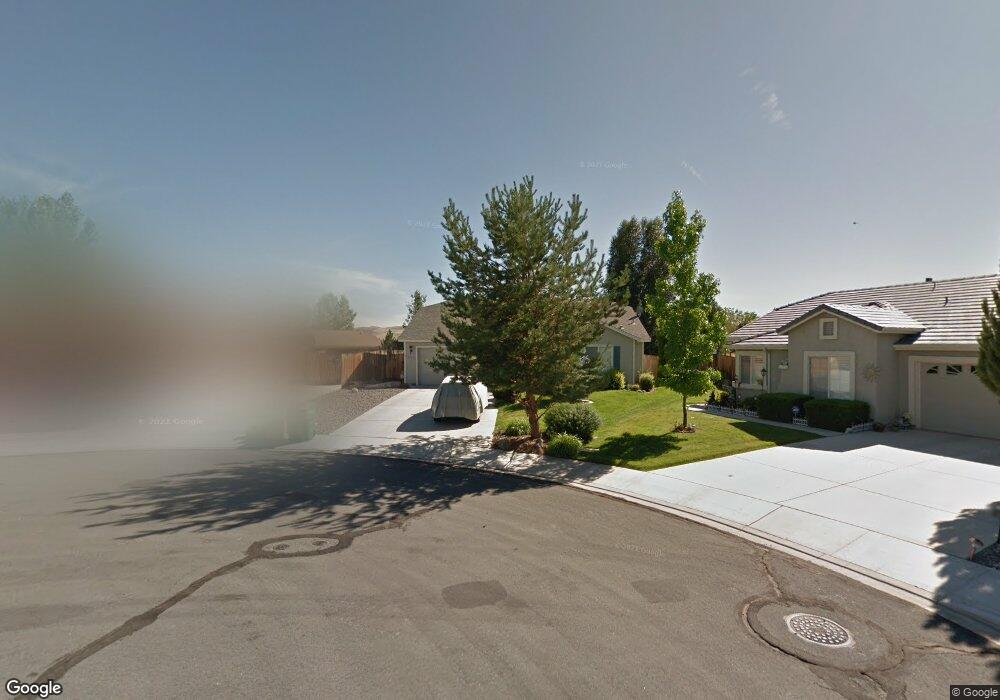
3113 Minino Ct Sparks, NV 89436
Wingfield Springs NeighborhoodEstimated Value: $506,897 - $537,000
3
Beds
2
Baths
1,440
Sq Ft
$363/Sq Ft
Est. Value
About This Home
This home is located at 3113 Minino Ct, Sparks, NV 89436 and is currently estimated at $522,474, approximately $362 per square foot. 3113 Minino Ct is a home located in Washoe County with nearby schools including Southern Elementary School, Van Gorder Elementary School, and Sky Ranch Middle School.
Ownership History
Date
Name
Owned For
Owner Type
Purchase Details
Closed on
Oct 5, 2018
Sold by
Fallows David and Fallows Elizabeth
Bought by
Sinkovec John and Sinkovec Joan
Current Estimated Value
Purchase Details
Closed on
Mar 19, 2004
Sold by
Paul Jeanine F and Bales Gerald F
Bought by
Fallows David and Fallows Elizabeth
Home Financials for this Owner
Home Financials are based on the most recent Mortgage that was taken out on this home.
Original Mortgage
$90,000
Interest Rate
5.56%
Mortgage Type
Unknown
Purchase Details
Closed on
Jan 8, 2003
Sold by
Paul Jeanine F
Bought by
Paul Jeanine F and Bales Gerald F
Purchase Details
Closed on
May 22, 1999
Sold by
Bighorn Development Ii Ltd
Bought by
Paul Duane A and Paul Jeanine F
Home Financials for this Owner
Home Financials are based on the most recent Mortgage that was taken out on this home.
Original Mortgage
$135,900
Interest Rate
6.86%
Create a Home Valuation Report for This Property
The Home Valuation Report is an in-depth analysis detailing your home's value as well as a comparison with similar homes in the area
Home Values in the Area
Average Home Value in this Area
Purchase History
| Date | Buyer | Sale Price | Title Company |
|---|---|---|---|
| Sinkovec John | $338,690 | Reliant Title Reno | |
| Fallows David | $245,000 | Stewart Title Of Northern Nv | |
| Paul Jeanine F | $185,000 | First American Title | |
| Paul Jeanine F | -- | First American Title | |
| Paul Duane A | $144,000 | First American Title Co |
Source: Public Records
Mortgage History
| Date | Status | Borrower | Loan Amount |
|---|---|---|---|
| Previous Owner | Fallows David | $90,000 | |
| Previous Owner | Paul Duane A | $135,900 |
Source: Public Records
Tax History Compared to Growth
Tax History
| Year | Tax Paid | Tax Assessment Tax Assessment Total Assessment is a certain percentage of the fair market value that is determined by local assessors to be the total taxable value of land and additions on the property. | Land | Improvement |
|---|---|---|---|---|
| 2026 | $1,190 | $101,076 | $41,125 | $59,952 |
| 2025 | $1,157 | $97,875 | $36,855 | $61,020 |
| 2024 | $1,157 | $93,843 | $32,200 | $61,643 |
| 2023 | $1,125 | $95,033 | $36,750 | $58,283 |
| 2022 | $1,151 | $77,101 | $28,490 | $48,611 |
| 2021 | $1,143 | $71,444 | $22,995 | $48,449 |
| 2020 | $1,090 | $72,243 | $23,625 | $48,618 |
| 2019 | $2,080 | $69,070 | $21,875 | $47,195 |
| 2018 | $1,985 | $62,057 | $15,785 | $46,272 |
| 2017 | $1,929 | $61,814 | $15,365 | $46,449 |
| 2016 | $1,879 | $60,961 | $13,685 | $47,276 |
| 2015 | $1,875 | $60,790 | $13,405 | $47,385 |
| 2014 | $1,820 | $56,130 | $10,430 | $45,700 |
| 2013 | -- | $45,290 | $8,155 | $37,135 |
Source: Public Records
Map
Nearby Homes
- 7766 Corneta Ct
- 7778 Cerritos Cir Unit 7
- 7718 Rhythm Cir
- 3245 Gerona Ct
- 7842 Alcandre Ct
- 7464 Europa Dr
- 7366 Grand Island Dr
- 7483 Europa Dr
- 7311 S Florentine Dr Unit 10A
- 3716 Early Dawn Dr
- 8495 Eaglenest Rd
- 3149 Gladiola Ct
- 7423 Comet Ct
- 7260 Treeline Ct
- 3461 Tavira Ct
- 7240 Silver King Dr
- 7859 Guerra Ct
- 8570 Eaglenest Rd
- 7220 Windswept Loop
- 7315 Silver King Dr
- 3103 Minino Ct
- 7703 Cerritos Cir Unit 7
- 7709 Cerritos Cir
- 7717 Cerritos Cir
- 3102 Minino Ct
- 3133 Minino Ct
- 7727 Cerritos Cir
- 7677 Corneta Ct
- 3122 Minino Ct Unit 7
- 3081 Bandera Ave
- 3075 Bandera Ave
- 3143 Minino Ct
- 3132 Minino Ct Unit 7
- 3067 Bandera Ave
- 3095 Bandera Ave
- 7757 Corneta Ct
- 7751 Corneta Ct
- 3142 Minino Ct
- 7702 Cerritos Cir
- 7710 Cerritos Cir