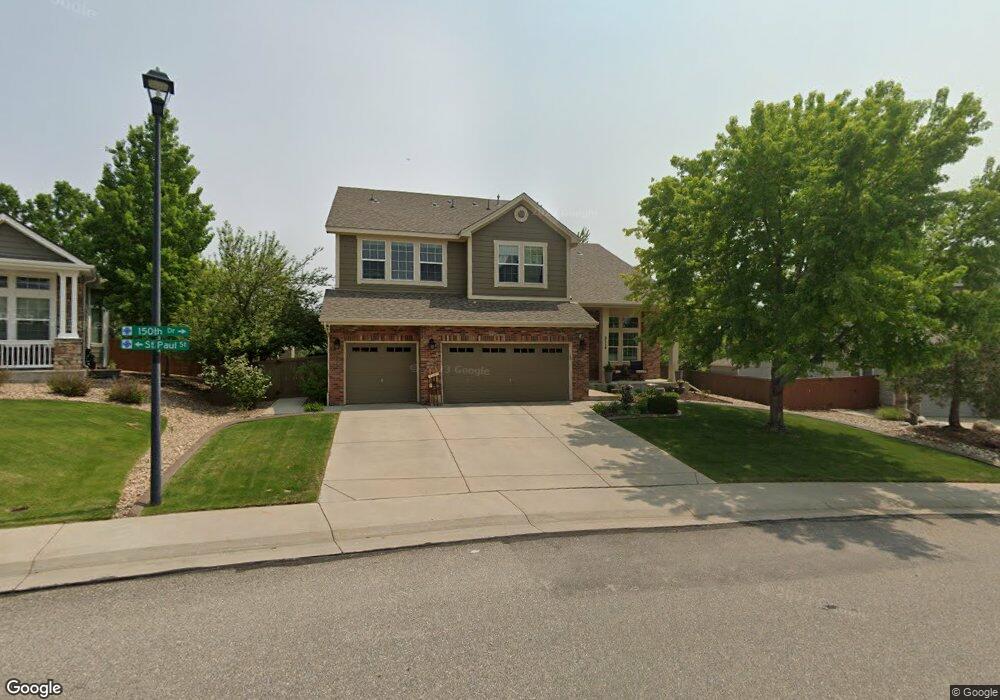
3114 E 150th Dr Thornton, CO 80602
The Haven at York Street NeighborhoodEstimated Value: $756,000 - $895,000
4
Beds
4
Baths
3,443
Sq Ft
$242/Sq Ft
Est. Value
About This Home
This home is located at 3114 E 150th Dr, Thornton, CO 80602 and is currently estimated at $833,061, approximately $241 per square foot. 3114 E 150th Dr is a home located in Adams County with nearby schools including Silver Creek Elementary School, Rocky Top Middle School, and Mountain Range High School.
Ownership History
Date
Name
Owned For
Owner Type
Purchase Details
Closed on
Dec 18, 2009
Sold by
Weichert Relocation Resources Inc
Bought by
Cianfrance Jason T and Cianfrance Jennifer A
Current Estimated Value
Home Financials for this Owner
Home Financials are based on the most recent Mortgage that was taken out on this home.
Original Mortgage
$360,000
Outstanding Balance
$230,982
Interest Rate
4.9%
Mortgage Type
New Conventional
Estimated Equity
$602,079
Purchase Details
Closed on
Aug 2, 2007
Sold by
Morris Gary D
Bought by
Gautreau John C and Gautreau Shelby B
Home Financials for this Owner
Home Financials are based on the most recent Mortgage that was taken out on this home.
Original Mortgage
$395,600
Interest Rate
6.73%
Mortgage Type
Unknown
Purchase Details
Closed on
Dec 28, 2006
Sold by
Tousa Homes Inc
Bought by
Morris Gary D
Create a Home Valuation Report for This Property
The Home Valuation Report is an in-depth analysis detailing your home's value as well as a comparison with similar homes in the area
Home Values in the Area
Average Home Value in this Area
Purchase History
| Date | Buyer | Sale Price | Title Company |
|---|---|---|---|
| Cianfrance Jason T | $450,000 | Land Title | |
| Weichert Relocation Resources Inc | $475,000 | Land Title | |
| Gautreau John C | $495,500 | Ult | |
| Morris Gary D | $401,700 | None Available |
Source: Public Records
Mortgage History
| Date | Status | Borrower | Loan Amount |
|---|---|---|---|
| Open | Cianfrance Jason T | $360,000 | |
| Previous Owner | Gautreau John C | $395,600 |
Source: Public Records
Tax History
| Year | Tax Paid | Tax Assessment Tax Assessment Total Assessment is a certain percentage of the fair market value that is determined by local assessors to be the total taxable value of land and additions on the property. | Land | Improvement |
|---|---|---|---|---|
| 2025 | $5,406 | $54,600 | $9,720 | $44,880 |
| 2024 | $5,406 | $50,190 | $8,940 | $41,250 |
| 2023 | $5,351 | $55,940 | $9,670 | $46,270 |
| 2022 | $4,518 | $41,010 | $9,940 | $31,070 |
| 2021 | $4,667 | $41,010 | $9,940 | $31,070 |
| 2020 | $4,596 | $41,200 | $10,220 | $30,980 |
| 2019 | $4,606 | $41,200 | $10,220 | $30,980 |
| 2018 | $4,307 | $37,430 | $7,560 | $29,870 |
| 2017 | $3,916 | $37,430 | $7,560 | $29,870 |
| 2016 | $3,757 | $34,960 | $6,930 | $28,030 |
| 2015 | $3,752 | $34,960 | $6,930 | $28,030 |
| 2014 | -- | $33,660 | $6,210 | $27,450 |
Source: Public Records
Map
Nearby Homes
- 15056 Fillmore Way
- 14955 Fillmore Way
- 15239 Detroit St
- 3072 E 152nd Cir
- 3092 E 152nd Cir
- 15254 Clayton St
- 3102 E 152nd Cir
- 15253 Detroit St
- 15260 Clayton St
- 15264 Clayton St
- 15274 Clayton St
- 15270 Clayton St
- 14718 Columbine St
- 14948 Gaylord St
- 15259 Adams Ct
- 15239 Adams Ct
- 3231 E 152nd Cir
- 15249 Adams Ct
- 15279 Adams Ct
- 15269 Adams Ct
- 3084 E 150th Dr
- 15054 St Paul St
- 15057 St Paul St
- 15058 St Paul St
- 3054 E 150th Dr
- 3024 E 150th Dr
- 15052 Fillmore Way
- 15064 St Paul St
- 15063 St Paul St
- 2994 E 150th Dr
- 15068 St Paul St
- 15067 St Paul St
- 15062 Fillmore Way
- 2959 E 150th Dr
- 15066 Fillmore Way
- 15074 Saint Paul St
- 15074 St Paul St
- 2984 E 150th Dr
- 15073 St Paul St
- 15065 Fillmore Way
Your Personal Tour Guide
Ask me questions while you tour the home.