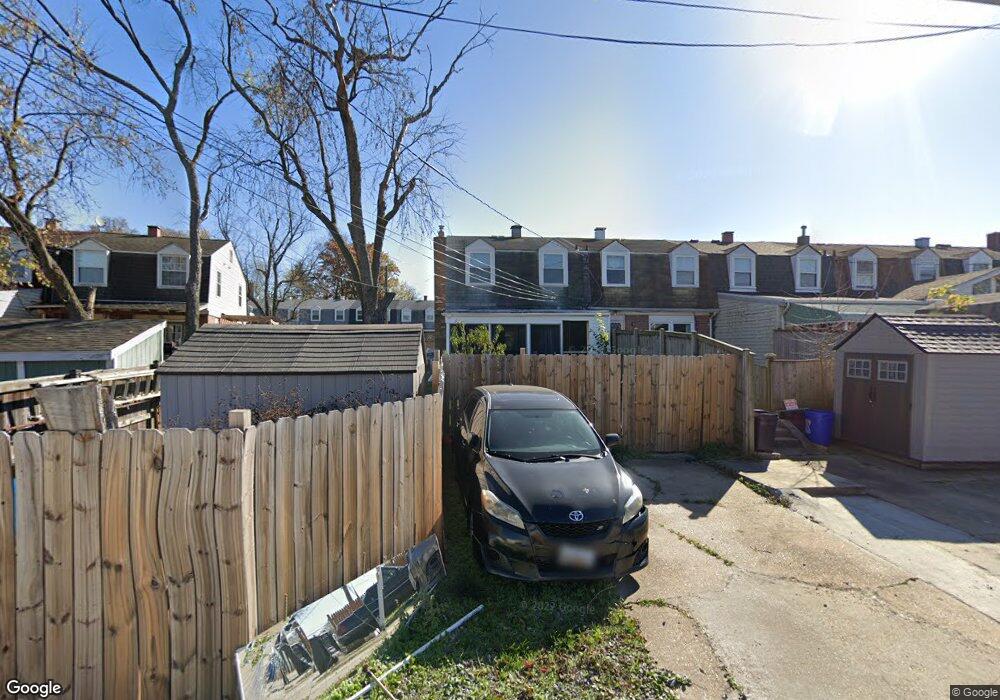
3114 Ryerson Cir Halethorpe, MD 21227
Lansdowne NeighborhoodEstimated Value: $175,262 - $208,000
Studio
1
Bath
1,116
Sq Ft
$176/Sq Ft
Est. Value
About This Home
This home is located at 3114 Ryerson Cir, Halethorpe, MD 21227 and is currently estimated at $196,316, approximately $175 per square foot. 3114 Ryerson Cir is a home located in Baltimore County with nearby schools including Riverview Elementary School, Lansdowne Middle School, and Lansdowne High School.
Ownership History
Date
Name
Owned For
Owner Type
Purchase Details
Closed on
Dec 17, 2023
Sold by
Nalley Tammy L
Bought by
Nalley Tammy L
Current Estimated Value
Home Financials for this Owner
Home Financials are based on the most recent Mortgage that was taken out on this home.
Original Mortgage
$100,400
Interest Rate
6.61%
Mortgage Type
New Conventional
Purchase Details
Closed on
Nov 5, 2003
Sold by
Secretary Of Housing & Urban
Bought by
Hickman Tammy L
Purchase Details
Closed on
Jun 24, 2003
Sold by
Siegert Howard Daniel
Bought by
Secretary Of Housing & Urban
Purchase Details
Closed on
Sep 27, 2000
Sold by
Smith Theresa A
Bought by
Siegert Howard Daniel and Siegert Cynthia Ann
Purchase Details
Closed on
Jan 18, 1996
Sold by
Wisnowski Stanley V
Bought by
Smith Theresa A
Create a Home Valuation Report for This Property
The Home Valuation Report is an in-depth analysis detailing your home's value as well as a comparison with similar homes in the area
Home Values in the Area
Average Home Value in this Area
Purchase History
| Date | Buyer | Sale Price | Title Company |
|---|---|---|---|
| Nalley Tammy L | -- | Priority Title | |
| Hickman Tammy L | $84,000 | -- | |
| Secretary Of Housing & Urban | $103,000 | -- | |
| Siegert Howard Daniel | $84,900 | -- | |
| Smith Theresa A | $79,900 | -- |
Source: Public Records
Mortgage History
| Date | Status | Borrower | Loan Amount |
|---|---|---|---|
| Previous Owner | Nalley Tammy L | $100,400 |
Source: Public Records
Tax History
| Year | Tax Paid | Tax Assessment Tax Assessment Total Assessment is a certain percentage of the fair market value that is determined by local assessors to be the total taxable value of land and additions on the property. | Land | Improvement |
|---|---|---|---|---|
| 2025 | $2,309 | $138,100 | -- | -- |
| 2024 | $2,309 | $130,800 | $37,400 | $93,400 |
| 2023 | $1,104 | $125,167 | $0 | $0 |
| 2022 | $2,085 | $119,533 | $0 | $0 |
| 2021 | $2,058 | $113,900 | $37,400 | $76,500 |
| 2020 | $2,058 | $113,533 | $0 | $0 |
| 2019 | $2,093 | $113,167 | $0 | $0 |
| 2018 | $2,088 | $112,800 | $37,400 | $75,400 |
| 2017 | $2,219 | $111,933 | $0 | $0 |
| 2016 | $2,047 | $111,067 | $0 | $0 |
| 2015 | $2,047 | $110,200 | $0 | $0 |
| 2014 | $2,047 | $110,200 | $0 | $0 |
Source: Public Records
Map
Nearby Homes
- 4157 Hollins Ferry Rd
- 801 Seckel Ct
- 302 4th Ave
- 401 2nd Ave
- 0 Monumental Ave Unit MDBC2082542
- 418 1st Ave
- 216 Clyde Ave
- 0 Hammonds Ferry Rd
- 238 Elizabeth Ave
- 4438 Scotia Rd
- 4435 Scotia Rd
- 35 Elizabeth Ave
- 3504 Shenandoah Ave
- 4415 Norfen Rd
- 2773 Yarnall Rd
- 4427 Annapolis Rd
- 104 Ridge Ave
- 2812 Florida Ave
- 2828 Alabama Ave
- 3207 Janice Ave
- 3116 Ryerson Cir
- 3112 Ryerson Cir
- 3118 Ryerson Cir
- 3110 Ryerson Cir
- 3122 Ryerson Cir
- 3108 Ryerson Cir
- 3106 Ryerson Cir
- 3124 Ryerson Cir
- 3104 Ryerson Cir
- 3312 Ryerson Cir
- 3102 Ryerson Cir
- 3314 Ryerson Cir
- 3126 Ryerson Cir
- 3316 Ryerson Cir
- 3310 Ryerson Cir
- 3318 Ryerson Cir
- 3308 Ryerson Cir
- 3320 Ryerson Cir
- 3128 Ryerson Cir
- 3306 Ryerson Cir
Your Personal Tour Guide
Ask me questions while you tour the home.