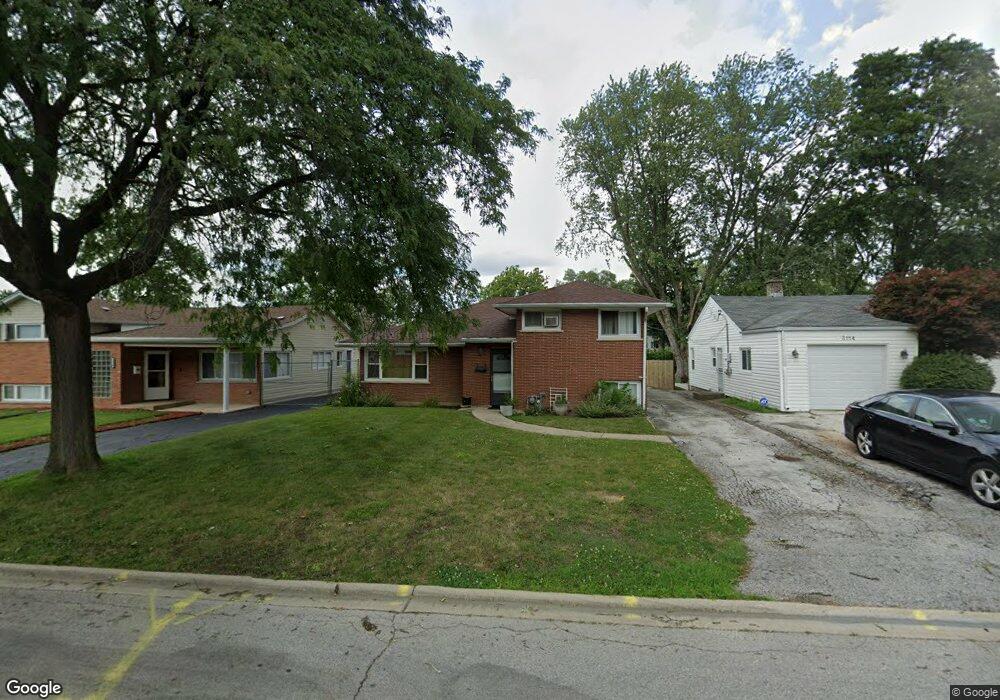
3116 173rd St Hazel Crest, IL 60429
Estimated Value: $201,371 - $249,000
4
Beds
3
Baths
1,259
Sq Ft
$178/Sq Ft
Est. Value
About This Home
This home is located at 3116 173rd St, Hazel Crest, IL 60429 and is currently estimated at $224,343, approximately $178 per square foot. 3116 173rd St is a home located in Cook County with nearby schools including Mae Jemison School, Prairie-Hills Junior High School, and Hillcrest High School.
Ownership History
Date
Name
Owned For
Owner Type
Purchase Details
Closed on
Feb 28, 2015
Sold by
Johnson Scherron E and Henry Keith
Bought by
Johnson Scherron E and Henry Keith
Current Estimated Value
Purchase Details
Closed on
Apr 1, 1999
Sold by
Johnson Scherron and Flippin Curtisine
Bought by
Johnson Scherron
Home Financials for this Owner
Home Financials are based on the most recent Mortgage that was taken out on this home.
Original Mortgage
$118,800
Outstanding Balance
$39,731
Interest Rate
10.87%
Estimated Equity
$184,612
Purchase Details
Closed on
Dec 30, 1994
Sold by
Phillips Investments Inc
Bought by
Johnson Scherron and Flippin Curtistine
Home Financials for this Owner
Home Financials are based on the most recent Mortgage that was taken out on this home.
Original Mortgage
$80,750
Interest Rate
9.27%
Purchase Details
Closed on
May 11, 1994
Sold by
Regency Svgs Bank Fsb
Bought by
Phillips Investments Inc
Create a Home Valuation Report for This Property
The Home Valuation Report is an in-depth analysis detailing your home's value as well as a comparison with similar homes in the area
Home Values in the Area
Average Home Value in this Area
Purchase History
| Date | Buyer | Sale Price | Title Company |
|---|---|---|---|
| Johnson Scherron E | -- | None Available | |
| Johnson Scherron | -- | Rei Title | |
| Johnson Scherron | $85,000 | -- | |
| Phillips Investments Inc | $43,500 | -- |
Source: Public Records
Mortgage History
| Date | Status | Borrower | Loan Amount |
|---|---|---|---|
| Open | Johnson Scherron | $118,800 | |
| Closed | Johnson Scherron | $80,750 |
Source: Public Records
Tax History
| Year | Tax Paid | Tax Assessment Tax Assessment Total Assessment is a certain percentage of the fair market value that is determined by local assessors to be the total taxable value of land and additions on the property. | Land | Improvement |
|---|---|---|---|---|
| 2025 | $7,522 | $14,927 | $2,161 | $12,766 |
| 2024 | $7,522 | $14,927 | $2,161 | $12,766 |
| 2023 | $4,564 | $18,000 | $2,161 | $15,839 |
| 2022 | $4,564 | $9,639 | $1,829 | $7,810 |
| 2021 | $4,462 | $9,637 | $1,828 | $7,809 |
| 2020 | $4,390 | $9,637 | $1,828 | $7,809 |
| 2019 | $4,136 | $9,607 | $1,662 | $7,945 |
| 2018 | $4,004 | $9,607 | $1,662 | $7,945 |
| 2017 | $3,778 | $9,607 | $1,662 | $7,945 |
| 2016 | $3,743 | $8,900 | $1,496 | $7,404 |
| 2015 | $3,516 | $8,900 | $1,496 | $7,404 |
| 2014 | $2,056 | $8,900 | $1,496 | $7,404 |
| 2013 | $3,275 | $10,220 | $1,496 | $8,724 |
Source: Public Records
Map
Nearby Homes
- 3107 173rd St
- 3100 Longfellow Ave
- 3004 Longfellow Ave
- 3213 Woodworth Place
- 3107 Longfellow Ave
- 17410 Emerson Ave
- 17417 Kedzie Ave
- 2904 Woodworth Place
- 17405 Longfellow Ave
- 17306 Burr Oak Ln
- 3311 Hickory Ln
- 3012 171st St Unit GT
- 3321 173rd St
- 17005 Albany Ave Unit 102
- 2912 175th St
- 17006 Novak Dr Unit T107
- 3312 Maple Ln
- 17120 Whittier Ave
- 2900 175th St
- 17113 Elm Dr
- 3114 173rd St
- 3118 173rd St
- 3120 173rd St
- 3112 173rd St
- 3119 Woodworth Place
- 3117 Woodworth Place
- 3110 173rd St
- 3122 173rd St
- 3123 Woodworth Place
- 3115 Woodworth Place
- 3108 173rd St
- 3125 Woodworth Place
- 3113 Woodworth Place
- 3113 173rd St
- 17301 Bryant Ln
- 3119 173rd St
- 3106 173rd St
- 3127 Woodworth Place
- 3109 173rd St
Your Personal Tour Guide
Ask me questions while you tour the home.