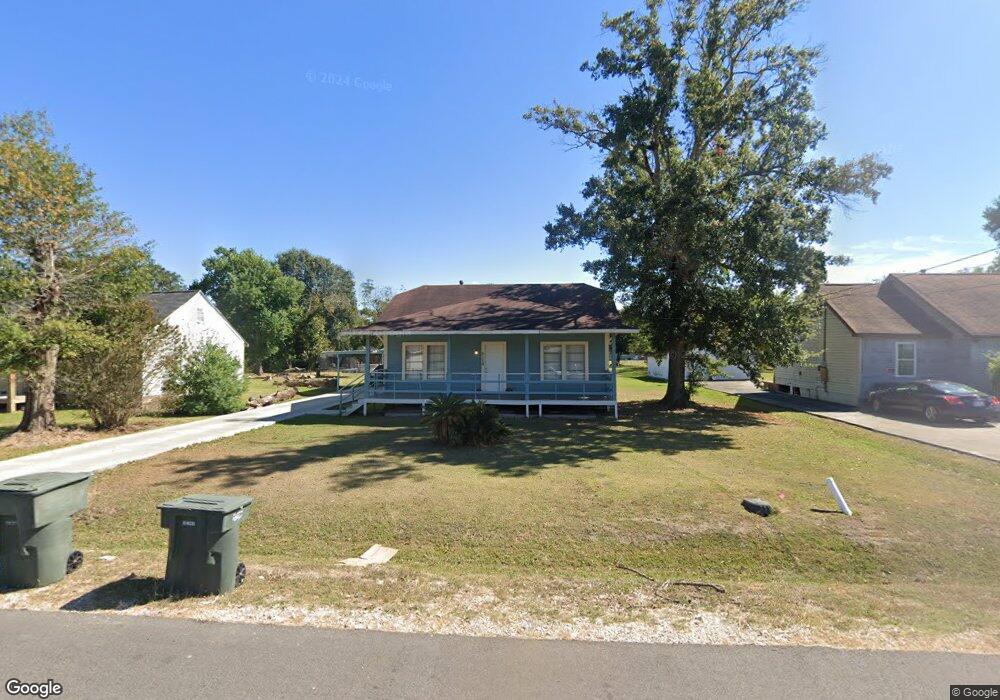
3116 27th St Port Arthur, TX 77642
Estimated Value: $80,000 - $159,000
--
Bed
--
Bath
1,024
Sq Ft
$115/Sq Ft
Est. Value
About This Home
This home is located at 3116 27th St, Port Arthur, TX 77642 and is currently estimated at $117,508, approximately $114 per square foot. 3116 27th St is a home located in Jefferson County with nearby schools including Houston Elementary School, Abraham Lincoln Middle School, and Memorial High School.
Ownership History
Date
Name
Owned For
Owner Type
Purchase Details
Closed on
Jun 27, 2016
Sold by
Vannguyen Be and Tat Nuoi
Bought by
Lepe Jose A Magana
Current Estimated Value
Purchase Details
Closed on
Sep 4, 2010
Sold by
Hilario Felipe
Bought by
Tat Nuoi
Purchase Details
Closed on
Mar 18, 2003
Sold by
Tat Nuoi
Bought by
Hilario Felipe
Purchase Details
Closed on
Mar 3, 2003
Sold by
Fontnette Deborah A Martin and Martin Deborah A
Bought by
Vanguyen Be and Tat Nuoi
Create a Home Valuation Report for This Property
The Home Valuation Report is an in-depth analysis detailing your home's value as well as a comparison with similar homes in the area
Home Values in the Area
Average Home Value in this Area
Purchase History
| Date | Buyer | Sale Price | Title Company |
|---|---|---|---|
| Lepe Jose A Magana | -- | None Available | |
| Tat Nuoi | -- | None Available | |
| Hilario Felipe | $24,000 | -- | |
| Vanguyen Be | -- | -- |
Source: Public Records
Mortgage History
| Date | Status | Borrower | Loan Amount |
|---|---|---|---|
| Closed | Hilario Felipe | $0 |
Source: Public Records
Tax History Compared to Growth
Tax History
| Year | Tax Paid | Tax Assessment Tax Assessment Total Assessment is a certain percentage of the fair market value that is determined by local assessors to be the total taxable value of land and additions on the property. | Land | Improvement |
|---|---|---|---|---|
| 2025 | $842 | $74,806 | -- | -- |
| 2024 | $842 | $68,005 | -- | -- |
| 2023 | $842 | $61,823 | $4,425 | $57,398 |
| 2022 | $1,862 | $58,634 | $4,425 | $54,209 |
| 2021 | $1,863 | $56,216 | $4,425 | $51,791 |
| 2020 | $1,275 | $38,474 | $4,425 | $34,049 |
| 2019 | $1,247 | $38,480 | $4,430 | $34,050 |
| 2018 | $610 | $34,480 | $4,430 | $30,050 |
| 2017 | $587 | $34,480 | $4,430 | $30,050 |
| 2016 | $1,010 | $34,480 | $4,430 | $30,050 |
| 2015 | $975 | $32,660 | $4,430 | $28,230 |
| 2014 | $975 | $32,660 | $4,430 | $28,230 |
Source: Public Records
Map
Nearby Homes