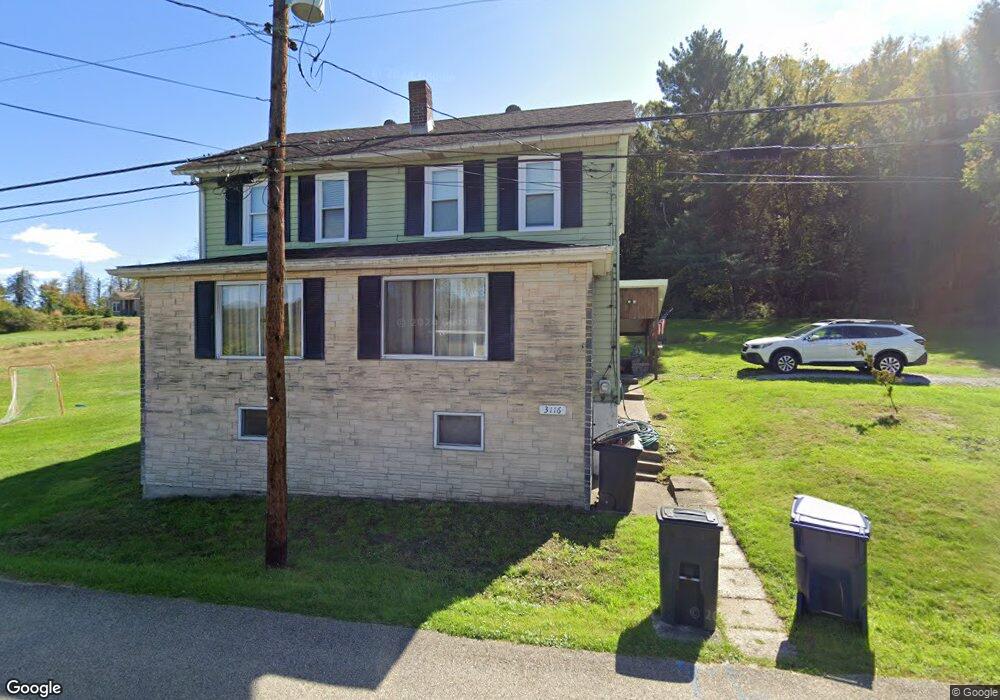
3116 Blocks Rd Claridge, PA 15623
Penn Township NeighborhoodEstimated Value: $81,000 - $218,000
--
Bed
--
Bath
1,620
Sq Ft
$83/Sq Ft
Est. Value
About This Home
This home is located at 3116 Blocks Rd, Claridge, PA 15623 and is currently estimated at $134,914, approximately $83 per square foot. 3116 Blocks Rd is a home located in Westmoreland County with nearby schools including Penn Trafford High School.
Ownership History
Date
Name
Owned For
Owner Type
Purchase Details
Closed on
Dec 4, 2023
Sold by
Sadler Edward F and Sadler Barbara J
Bought by
Mccaw Nikki
Current Estimated Value
Home Financials for this Owner
Home Financials are based on the most recent Mortgage that was taken out on this home.
Original Mortgage
$64,350
Outstanding Balance
$63,340
Interest Rate
7.79%
Mortgage Type
New Conventional
Estimated Equity
$71,574
Purchase Details
Closed on
May 17, 2023
Sold by
Sadler Barbara J and Sadler Edward F
Bought by
Cartwright Marc and Cartwright Alejandra
Purchase Details
Closed on
Aug 5, 2022
Sold by
Mccaw Allen E
Bought by
Sadler Edward and Sadler Barbara
Purchase Details
Closed on
Jul 17, 2007
Sold by
Ocepek Linda J
Bought by
Mccaw Allen
Home Financials for this Owner
Home Financials are based on the most recent Mortgage that was taken out on this home.
Original Mortgage
$114,408
Interest Rate
6.54%
Mortgage Type
VA
Create a Home Valuation Report for This Property
The Home Valuation Report is an in-depth analysis detailing your home's value as well as a comparison with similar homes in the area
Home Values in the Area
Average Home Value in this Area
Purchase History
| Date | Buyer | Sale Price | Title Company |
|---|---|---|---|
| Mccaw Nikki | $65,000 | None Listed On Document | |
| Cartwright Marc | $25,000 | None Listed On Document | |
| Sadler Edward | $87,000 | None Listed On Document | |
| Mccaw Allen | $112,000 | None Available |
Source: Public Records
Mortgage History
| Date | Status | Borrower | Loan Amount |
|---|---|---|---|
| Open | Mccaw Nikki | $64,350 | |
| Previous Owner | Mccaw Allen | $114,408 |
Source: Public Records
Tax History Compared to Growth
Tax History
| Year | Tax Paid | Tax Assessment Tax Assessment Total Assessment is a certain percentage of the fair market value that is determined by local assessors to be the total taxable value of land and additions on the property. | Land | Improvement |
|---|---|---|---|---|
| 2025 | $1,150 | $8,400 | $1,670 | $6,730 |
| 2024 | $1,185 | $8,880 | $2,150 | $6,730 |
| 2023 | $1,145 | $8,880 | $2,150 | $6,730 |
| 2022 | $1,132 | $8,880 | $2,150 | $6,730 |
| 2021 | $1,123 | $8,880 | $2,150 | $6,730 |
| 2020 | $1,114 | $8,880 | $2,150 | $6,730 |
| 2019 | $1,087 | $8,880 | $2,150 | $6,730 |
| 2018 | $1,056 | $8,880 | $2,150 | $6,730 |
| 2017 | $1,030 | $8,880 | $2,150 | $6,730 |
| 2016 | $999 | $8,880 | $2,150 | $6,730 |
| 2015 | $999 | $8,880 | $2,150 | $6,730 |
| 2014 | $982 | $8,880 | $2,150 | $6,730 |
Source: Public Records
Map
Nearby Homes
- 3168 Main St
- 2033 Bushy Run Rd
- 2211 Newton St
- 2052 Main St
- 2002 Callaway Dr
- 5004 Wellington Ct
- 000 Harrold St
- Thornewood w/ Finished Basement Plan at Wellington
- 1004 Deveron Ct
- 49 Nancy Dr
- 3005 Wellington Ct
- 5004 Wellington Ct
- 1007 Wellington Ct
- 5006 Wellington Ct
- 6002 Wellington Ct
- 114 Adella Ct
- 109 Fieldstone Ct
- 14 and 16 Theodore Dr
- 00 Harrold St (Parcel B)
- 182 Palm Ct
- 3115 Blocks Rd
- 3117 Blocks Rd
- 3112 Blocks Rd
- 3119 Blocks Rd
- 3182 Main St
- 4022 Sr
- 3123 Blocks Rd
- 3118 Blocks Rd
- 3180 Main St
- 3107 Blocks Rd
- 3128 Blocks Rd
- 3166 Main St
- 3106 Blocks Rd
- 3339 Main St
- 3110 Bratkovich Rd
- 211 Main St
- 3114 Bratkovich Rd
- 3114 Bratkovich Rd
- 3102 Denmark St
- 3200 Constitution Dr