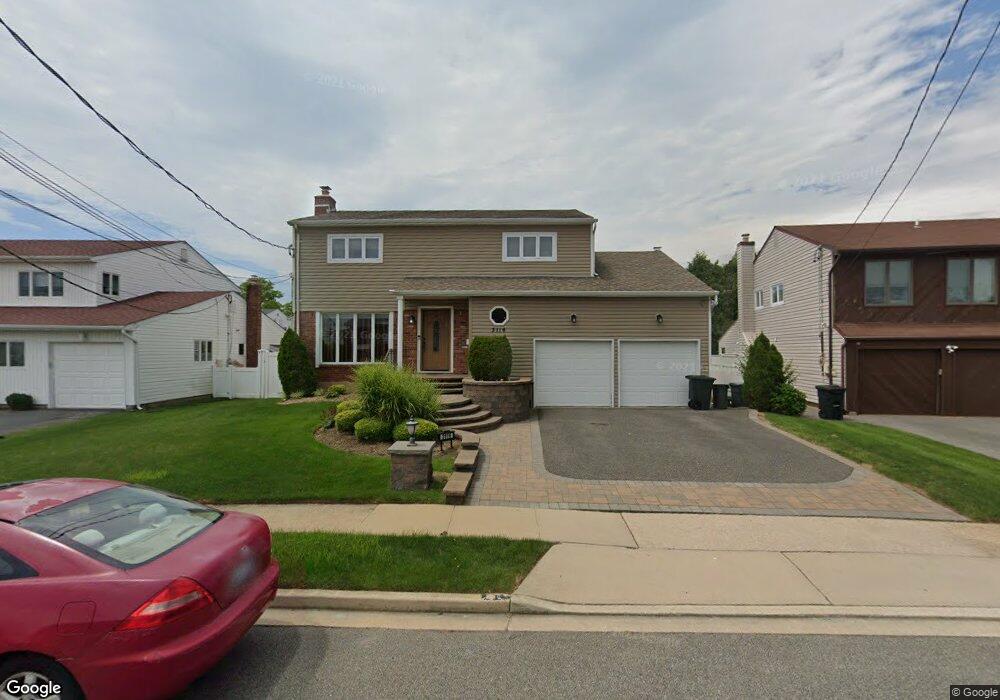
3116 Camden Ln Merrick, NY 11566
Estimated Value: $1,145,074 - $1,296,000
--
Bed
4
Baths
2,462
Sq Ft
$496/Sq Ft
Est. Value
About This Home
This home is located at 3116 Camden Ln, Merrick, NY 11566 and is currently estimated at $1,220,537, approximately $495 per square foot. 3116 Camden Ln is a home located in Nassau County with nearby schools including Burcham Elementary School, Merrick Avenue Middle School, and John F. Kennedy High School.
Ownership History
Date
Name
Owned For
Owner Type
Purchase Details
Closed on
May 6, 2021
Sold by
Benzenberg Robert and Benzenberg Patricia E
Bought by
Ali Hasan and Alam Shaila
Current Estimated Value
Purchase Details
Closed on
Apr 6, 2009
Sold by
Naar David
Bought by
Pollock Theodore
Purchase Details
Closed on
Sep 1, 2005
Sold by
Wapner Jon
Bought by
Naar David
Purchase Details
Closed on
Jun 15, 1999
Sold by
Greenberg Gary
Bought by
Wapner On and Wapner Joan
Create a Home Valuation Report for This Property
The Home Valuation Report is an in-depth analysis detailing your home's value as well as a comparison with similar homes in the area
Home Values in the Area
Average Home Value in this Area
Purchase History
| Date | Buyer | Sale Price | Title Company |
|---|---|---|---|
| Ali Hasan | $540,000 | Fidelity National Title | |
| Pollock Theodore | $750,000 | -- | |
| Pollock Theodore | $750,000 | -- | |
| Naar David | $730,000 | -- | |
| Naar David | $730,000 | -- | |
| Wapner On | $425,000 | -- | |
| Wapner On | $425,000 | -- |
Source: Public Records
Tax History Compared to Growth
Tax History
| Year | Tax Paid | Tax Assessment Tax Assessment Total Assessment is a certain percentage of the fair market value that is determined by local assessors to be the total taxable value of land and additions on the property. | Land | Improvement |
|---|---|---|---|---|
| 2025 | $20,945 | $690 | $227 | $463 |
| 2024 | $4,273 | $658 | $216 | $442 |
| 2023 | $16,751 | $696 | $229 | $467 |
| 2022 | $16,751 | $706 | $232 | $474 |
| 2021 | $20,855 | $732 | $222 | $510 |
| 2020 | $12,788 | $777 | $426 | $351 |
| 2019 | $13,296 | $833 | $429 | $404 |
| 2018 | $13,398 | $888 | $0 | $0 |
| 2017 | $9,436 | $944 | $432 | $512 |
| 2016 | $13,476 | $999 | $411 | $588 |
| 2015 | $4,187 | $1,055 | $434 | $621 |
| 2014 | $4,187 | $1,055 | $434 | $621 |
| 2013 | $4,168 | $1,110 | $457 | $653 |
Source: Public Records
Map
Nearby Homes