Estimated Value: $600,000 - $668,000
3
Beds
3
Baths
1,298
Sq Ft
$493/Sq Ft
Est. Value
About This Home
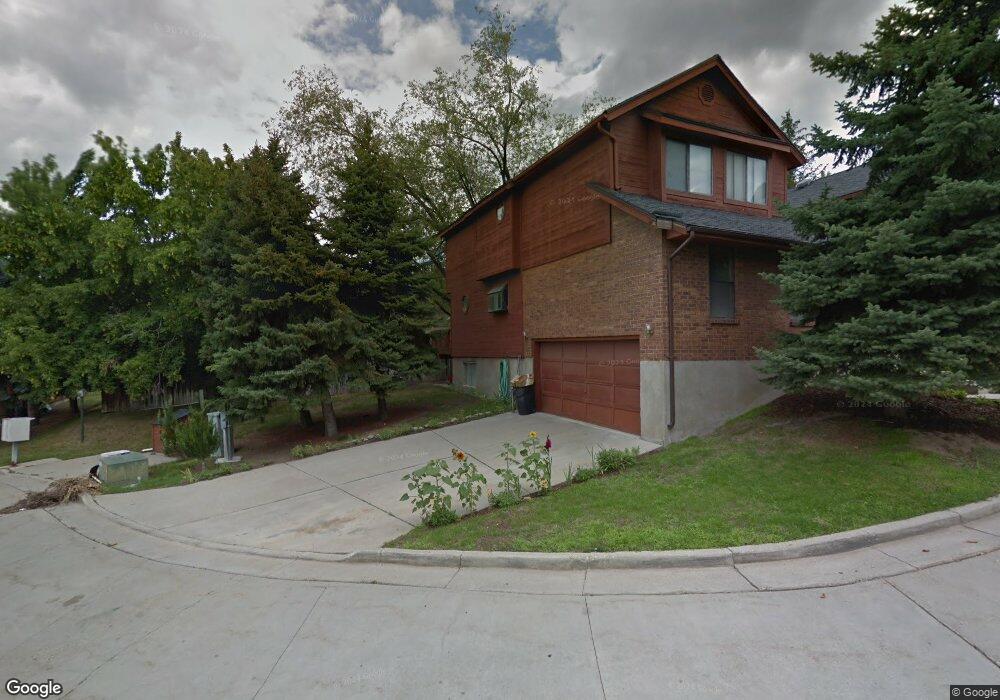
This home is located at 3116 High Danish Rd, Sandy, UT 84093 and is currently estimated at $640,326, approximately $493 per square foot. 3116 High Danish Rd is a home located in Salt Lake County with nearby schools including Canyon View School, Butler Middle School, and Brighton High School.
Ownership History
Date
Name
Owned For
Owner Type
Purchase Details
Closed on
May 11, 2023
Sold by
Price Preston Evan
Bought by
Draper Sharon and Draper Richard
Current Estimated Value
Home Financials for this Owner
Home Financials are based on the most recent Mortgage that was taken out on this home.
Original Mortgage
$584,910
Outstanding Balance
$568,438
Interest Rate
6.32%
Mortgage Type
New Conventional
Estimated Equity
$71,889
Purchase Details
Closed on
Dec 30, 2019
Sold by
Lillian Smith
Bought by
Evan Price Preston and Evan Melissa Price
Home Financials for this Owner
Home Financials are based on the most recent Mortgage that was taken out on this home.
Original Mortgage
$345,800
Interest Rate
3.7%
Mortgage Type
New Conventional
Purchase Details
Closed on
Oct 20, 2000
Sold by
Smith Lillian
Bought by
Smith Lillian and The Lillian Smith Trust
Purchase Details
Closed on
Oct 3, 1994
Sold by
Coffman John
Bought by
Smith Lillian
Create a Home Valuation Report for This Property
The Home Valuation Report is an in-depth analysis detailing your home's value as well as a comparison with similar homes in the area
Home Values in the Area
Average Home Value in this Area
Purchase History
| Date | Buyer | Sale Price | Title Company |
|---|---|---|---|
| Draper Sharon | -- | Integrated Title Services | |
| Evan Price Preston | -- | First American Title | |
| Smith Lillian | -- | -- | |
| Smith Lillian | -- | -- |
Source: Public Records
Mortgage History
| Date | Status | Borrower | Loan Amount |
|---|---|---|---|
| Open | Draper Sharon | $584,910 | |
| Previous Owner | Evan Price Preston | $345,800 |
Source: Public Records
Tax History Compared to Growth
Tax History
| Year | Tax Paid | Tax Assessment Tax Assessment Total Assessment is a certain percentage of the fair market value that is determined by local assessors to be the total taxable value of land and additions on the property. | Land | Improvement |
|---|---|---|---|---|
| 2025 | $3,478 | $476,300 | $142,900 | $333,400 |
| 2024 | $3,478 | $620,200 | $186,000 | $434,200 |
| 2023 | $3,241 | $562,100 | $168,600 | $393,500 |
| 2022 | $3,164 | $541,300 | $162,400 | $378,900 |
| 2021 | $2,476 | $352,600 | $105,800 | $246,800 |
| 2020 | $2,641 | $353,500 | $106,000 | $247,500 |
| 2019 | $2,666 | $346,500 | $103,900 | $242,600 |
| 2018 | $2,558 | $345,600 | $103,700 | $241,900 |
| 2017 | $667 | $312,800 | $93,800 | $219,000 |
| 2016 | $180 | $268,800 | $80,600 | $188,200 |
| 2015 | $2,172 | $255,800 | $76,800 | $179,000 |
| 2014 | $2,212 | $253,300 | $76,000 | $177,300 |
Source: Public Records
Map
Nearby Homes
- 3181 E Deer Creek Cove
- 2986 E Scandia Way
- 3143 E Bavarian Ct
- 8035 S Danish Rd
- 8022 Deer Creek Rd
- 3338 E Creek Rd
- 3364 E Creek Rd
- 7911 Willowcrest Rd
- 3388 E Stonehill Ln
- 2935 E Denmark Dr
- 8211 S 2660 E
- 3256 E Mcneill Cir
- 3558 E Wasatch Grove Ln
- 8135 Clover Spring Ln
- 3556 E Rustic Spring Ln
- 2862 E Pamela Dr
- 2614 E Tuxedo Cir
- 3376 E Daneborg Dr
- 8711 Rustler Rd
- 3522 Bengal Blvd
- 3116 E High Danish Cir
- 3116 E High Danish Rd
- 3114 E High Danish Rd Unit 4
- 3114 E High Danish Rd
- 3125 High Danish Rd
- 3130 E High Danish Rd Unit 2
- 3127 High Danish Rd Unit 12
- 8152 S Danish Rd
- 3132 E High Danish Rd Unit 1
- 8152 S Danish Rd
- 3104 E High Danish Cir
- 3104 E High Danish Rd
- 3105 High Danish Rd
- 8154 S Danish Rd Unit 24A
- 3099 High Danish Rd
- 3125 E High Danish Rd
- 3102 High Danish Rd Unit 6
- 8171 S Nordic Cir
- 3127 E High Danish Rd
- 3127 E High Danish Rd