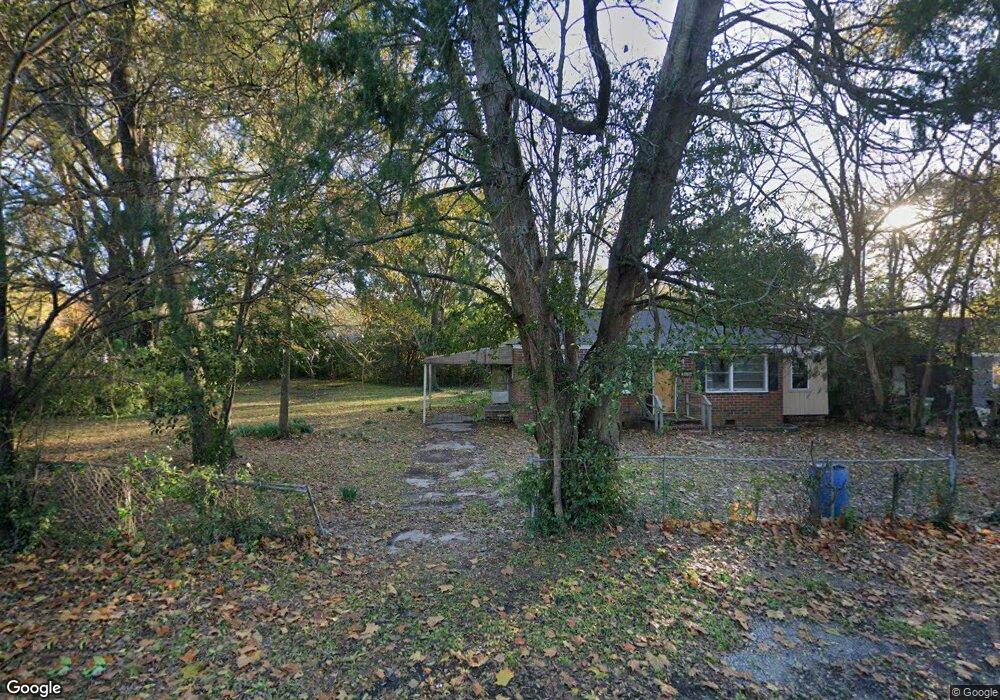
3116 Knox St Columbus, GA 31903
Southern Columbus NeighborhoodEstimated Value: $48,000 - $71,000
3
Beds
2
Baths
942
Sq Ft
$62/Sq Ft
Est. Value
About This Home
This home is located at 3116 Knox St, Columbus, GA 31903 and is currently estimated at $58,253, approximately $61 per square foot. 3116 Knox St is a home located in Muscogee County with nearby schools including South Columbus Elementary School, Eddy Middle School, and Spencer High School.
Ownership History
Date
Name
Owned For
Owner Type
Purchase Details
Closed on
May 29, 2024
Sold by
House And Home Rentals Llc
Bought by
Columbus Houses Llc
Current Estimated Value
Home Financials for this Owner
Home Financials are based on the most recent Mortgage that was taken out on this home.
Original Mortgage
$3,605,000
Outstanding Balance
$1,817,374
Interest Rate
7.1%
Mortgage Type
Seller Take Back
Estimated Equity
-$1,759,121
Purchase Details
Closed on
May 18, 2022
Sold by
Mccorlew Realty Inc
Bought by
House And Home Rentals Llc
Create a Home Valuation Report for This Property
The Home Valuation Report is an in-depth analysis detailing your home's value as well as a comparison with similar homes in the area
Home Values in the Area
Average Home Value in this Area
Purchase History
| Date | Buyer | Sale Price | Title Company |
|---|---|---|---|
| Columbus Houses Llc | $4,400,000 | None Listed On Document | |
| House And Home Rentals Llc | $2,317,400 | Page Scrantom Sprouse Tucker & |
Source: Public Records
Mortgage History
| Date | Status | Borrower | Loan Amount |
|---|---|---|---|
| Open | Columbus Houses Llc | $3,605,000 |
Source: Public Records
Tax History Compared to Growth
Tax History
| Year | Tax Paid | Tax Assessment Tax Assessment Total Assessment is a certain percentage of the fair market value that is determined by local assessors to be the total taxable value of land and additions on the property. | Land | Improvement |
|---|---|---|---|---|
| 2025 | $827 | $21,128 | $6,196 | $14,932 |
| 2024 | $599 | $15,304 | $4,212 | $11,092 |
| 2023 | $603 | $15,304 | $4,212 | $11,092 |
| 2022 | $447 | $10,940 | $4,212 | $6,728 |
| 2021 | $422 | $10,340 | $4,212 | $6,128 |
| 2020 | $422 | $10,340 | $4,212 | $6,128 |
| 2019 | $424 | $10,340 | $4,212 | $6,128 |
| 2018 | $470 | $13,504 | $4,212 | $9,292 |
| 2017 | $555 | $13,504 | $4,212 | $9,292 |
| 2016 | $452 | $10,956 | $1,800 | $9,156 |
| 2015 | $452 | $10,956 | $1,800 | $9,156 |
| 2014 | $453 | $10,956 | $1,800 | $9,156 |
| 2013 | -- | $10,956 | $1,800 | $9,156 |
Source: Public Records
Map
Nearby Homes
- 2333 Bruce Ave
- 2404 Bruce Ave
- 3310 Albert St
- 2203 Simmons Ave
- 2417 Manning Ave
- 3042 Colonial Dr
- 2102 Somerset Ave
- 3015 Hendrix St
- 2425 Howe Ave
- 2846 Walker St
- 3009 Plantation Rd
- 41 Ticknor Dr
- 2320 Fort Benning Rd
- 2550 Cornell Ave
- 38 Ross Ave
- 2309 Ginny Ave
- 122 Torch Hill Rd
- 2313 Dorothy Ave
- 37 Mathews St
- 2973 Hawthorne Dr
- 3112 Knox St
- 3128 Knox St
- 3119 Drake St
- 3123 Drake St
- 2302 S Lumpkin Rd
- 2306 S Lumpkin Rd
- 3113 Drake St
- 2307 Simmons Ave
- 3129 Drake St
- 2313 Simmons Ave
- 3134 Knox St
- 2314 S Lumpkin Rd
- 2254 S Lumpkin Rd
- 3115 Knox St
- 3121 Knox St
- 3127 Knox St
- 3135 Drake St
- 2320 S Lumpkin Rd
- 3133 Knox St
- 2242 S Lumpkin Rd