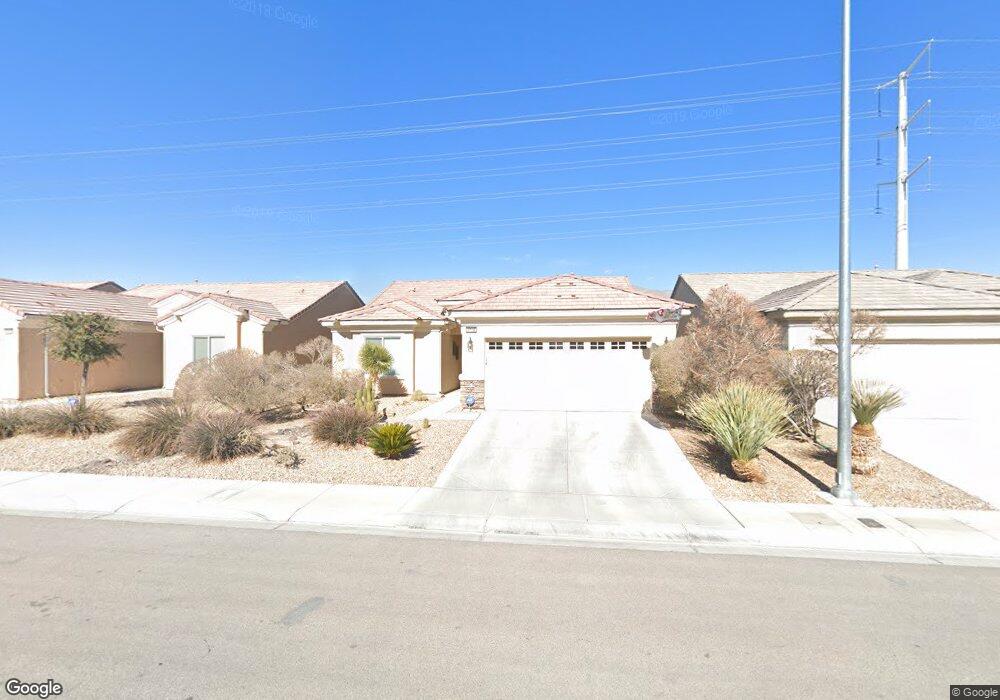
3116 Kookaburra Way Unit 3 North Las Vegas, NV 89084
Aliante NeighborhoodEstimated Value: $390,599 - $412,000
2
Beds
2
Baths
1,570
Sq Ft
$258/Sq Ft
Est. Value
About This Home
This home is located at 3116 Kookaburra Way Unit 3, North Las Vegas, NV 89084 and is currently estimated at $405,400, approximately $258 per square foot. 3116 Kookaburra Way Unit 3 is a home located in Clark County with nearby schools including Vincent L. Triggs Elementary School, Anthony Saville Middle School, and Shadow Ridge High School.
Ownership History
Date
Name
Owned For
Owner Type
Purchase Details
Closed on
Oct 3, 2006
Sold by
Firestone Charles and Firestone Linda
Bought by
Firestone Charles and Firestone Linda
Current Estimated Value
Purchase Details
Closed on
Aug 13, 2004
Sold by
Pn Ii Inc
Bought by
Firestone Charles and Firestone Linda
Home Financials for this Owner
Home Financials are based on the most recent Mortgage that was taken out on this home.
Original Mortgage
$255,336
Outstanding Balance
$118,138
Interest Rate
5%
Mortgage Type
Unknown
Estimated Equity
$287,262
Create a Home Valuation Report for This Property
The Home Valuation Report is an in-depth analysis detailing your home's value as well as a comparison with similar homes in the area
Home Values in the Area
Average Home Value in this Area
Purchase History
| Date | Buyer | Sale Price | Title Company |
|---|---|---|---|
| Firestone Charles | -- | None Available | |
| Firestone Charles | $319,170 | Lawyers Title Of Nevada |
Source: Public Records
Mortgage History
| Date | Status | Borrower | Loan Amount |
|---|---|---|---|
| Open | Firestone Charles | $255,336 |
Source: Public Records
Tax History Compared to Growth
Tax History
| Year | Tax Paid | Tax Assessment Tax Assessment Total Assessment is a certain percentage of the fair market value that is determined by local assessors to be the total taxable value of land and additions on the property. | Land | Improvement |
|---|---|---|---|---|
| 2025 | $2,057 | $98,826 | $28,000 | $70,826 |
| 2024 | $1,998 | $98,826 | $28,000 | $70,826 |
| 2023 | $1,998 | $96,974 | $30,100 | $66,874 |
| 2022 | $1,940 | $86,869 | $25,900 | $60,969 |
| 2021 | $1,883 | $80,941 | $23,100 | $57,841 |
| 2020 | $1,822 | $79,540 | $22,400 | $57,140 |
| 2019 | $1,769 | $76,511 | $20,300 | $56,211 |
| 2018 | $1,717 | $70,124 | $16,100 | $54,024 |
| 2017 | $2,301 | $67,753 | $14,000 | $53,753 |
| 2016 | $1,627 | $66,080 | $12,250 | $53,830 |
| 2015 | $1,623 | $53,297 | $9,800 | $43,497 |
| 2014 | $1,575 | $44,751 | $7,000 | $37,751 |
Source: Public Records
Map
Nearby Homes
- 3108 Kookaburra Way
- 7948 Fantail Dr Unit 3
- 7921 Fantail Dr
- 7905 Grey Teal St
- 3405 Kingbird Dr
- 3312 Lapwing Dr
- 2822 Horned Owl Way
- 7910 Kiskadee St
- 3220 Flinthead Dr
- 7804 Island Rail Dr
- 3516 Herring Gull Ln Unit 3
- 7741 Fruit Dove St Unit 4
- 7908 House Sparrow St
- 7870 Widewing Dr
- 2525 Willow Wren Dr
- 7839 Lyrebird Dr
- 7713 Songster St
- 8048 Slate Falls St
- 3765 Helens Pouroff Ave
- 2320 Willow Wren Dr
- 3112 Kookaburra Way
- 3120 Kookaburra Way
- 3124 Kookaburra Way
- 3117 Kookaburra Way Unit 3
- 3113 Kookaburra Way
- 3204 Kookaburra Way
- 3104 Kookaburra Way
- 3121 Kookaburra Way
- 3121 Kookaburra Way Unit n/a
- 3109 Kookaburra Way
- 3125 Kookaburra Way Unit 3
- 3208 Kookaburra Way
- 3024 Kookaburra Way
- 3105 Kookaburra Way
- 3205 Kookaburra Way
- 3205 Kookaburra Way
- 3120 Kingbird Dr
- 3116 Kingbird Dr
- 3212 Kookaburra Way
- 3212 Kookaburra Way Unit n/a