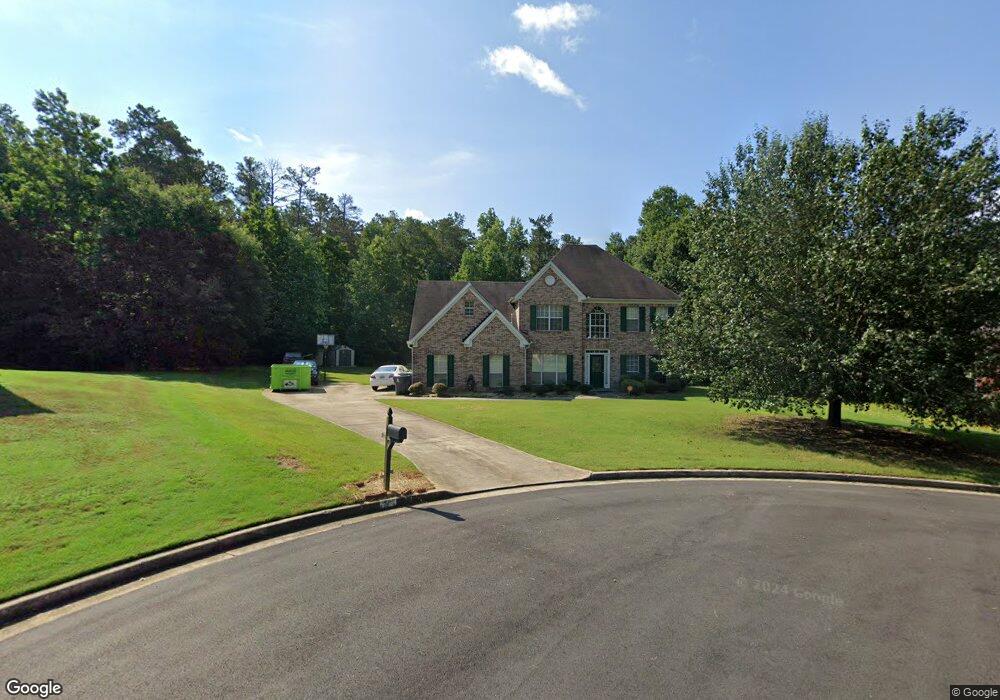
3116 Linsley Ct SW Unit 4 Conyers, GA 30094
Estimated Value: $363,687 - $447,000
4
Beds
3
Baths
2,735
Sq Ft
$143/Sq Ft
Est. Value
About This Home
This home is located at 3116 Linsley Ct SW Unit 4, Conyers, GA 30094 and is currently estimated at $390,172, approximately $142 per square foot. 3116 Linsley Ct SW Unit 4 is a home located in Rockdale County with nearby schools including Shoal Creek Elementary School, Gen. Ray Davis Middle School, and Rockdale County High School.
Ownership History
Date
Name
Owned For
Owner Type
Purchase Details
Closed on
Mar 31, 2023
Sold by
Smith Christopher S
Bought by
Smith Marcia W
Current Estimated Value
Purchase Details
Closed on
Aug 25, 2006
Sold by
Thompkins Brian R and Thompkins India A
Bought by
Smith Marcia W and Smith Christopher
Home Financials for this Owner
Home Financials are based on the most recent Mortgage that was taken out on this home.
Original Mortgage
$146,900
Interest Rate
6.73%
Mortgage Type
New Conventional
Purchase Details
Closed on
Dec 5, 2000
Sold by
Manor Homes
Bought by
Thompkins Brian R and Thompkins India A
Home Financials for this Owner
Home Financials are based on the most recent Mortgage that was taken out on this home.
Original Mortgage
$168,511
Interest Rate
7.65%
Mortgage Type
New Conventional
Purchase Details
Closed on
Sep 15, 1998
Sold by
R & R Custom Hms Inc
Bought by
Pursell Virginia W and Pursell Susan
Home Financials for this Owner
Home Financials are based on the most recent Mortgage that was taken out on this home.
Original Mortgage
$115,800
Interest Rate
6.95%
Mortgage Type
New Conventional
Create a Home Valuation Report for This Property
The Home Valuation Report is an in-depth analysis detailing your home's value as well as a comparison with similar homes in the area
Home Values in the Area
Average Home Value in this Area
Purchase History
| Date | Buyer | Sale Price | Title Company |
|---|---|---|---|
| Smith Marcia W | -- | -- | |
| Smith Marcia W | $209,900 | -- | |
| Thompkins Brian R | $169,900 | -- | |
| Pursell Virginia W | $144,800 | -- |
Source: Public Records
Mortgage History
| Date | Status | Borrower | Loan Amount |
|---|---|---|---|
| Previous Owner | Smith Marcia W | $146,900 | |
| Previous Owner | Thompkins Brian R | $168,511 | |
| Previous Owner | Pursell Virginia W | $115,800 |
Source: Public Records
Tax History Compared to Growth
Tax History
| Year | Tax Paid | Tax Assessment Tax Assessment Total Assessment is a certain percentage of the fair market value that is determined by local assessors to be the total taxable value of land and additions on the property. | Land | Improvement |
|---|---|---|---|---|
| 2024 | $4,131 | $164,800 | $27,600 | $137,200 |
| 2023 | $2,593 | $110,200 | $26,200 | $84,000 |
| 2022 | $1,474 | $66,600 | $15,360 | $51,240 |
| 2021 | $1,568 | $66,600 | $15,360 | $51,240 |
| 2020 | $1,553 | $65,600 | $14,360 | $51,240 |
| 2019 | $1,408 | $59,640 | $8,400 | $51,240 |
| 2018 | $1,417 | $59,640 | $8,400 | $51,240 |
| 2017 | $1,313 | $55,720 | $8,400 | $47,320 |
| 2016 | $1,214 | $55,720 | $8,400 | $47,320 |
| 2015 | $1,217 | $55,720 | $8,400 | $47,320 |
| 2014 | $1,092 | $55,720 | $8,400 | $47,320 |
| 2013 | -- | $61,400 | $9,600 | $51,800 |
Source: Public Records
Map
Nearby Homes
- 3495 Heathervale Way SW
- 2204 Brandon Ln SW Unit 2
- 2215 Brandon Ln SW Unit 3
- 726 McDaniel Mill Rd SW
- 3250 Klondike Rd SW
- 2091 Moon Dr SW
- 2194 Klondike Rd SW
- 1084 W Adrian Cir SW
- 1087 W Adrian Cir SW
- 1092 W Adrian Cir SW
- 1107 W Adrian Cir SW
- 650 Jefferson Dr SW
- 1103 W Adrian Cir SW
- 845 Smyrna Rd SW
- 740 Smyrna Rd SW
- 1039 Smyrna Rd SW
- 1918 Leigh Dr SW
- 0 Klondike Rd SW Unit 7601318
- 0 Klondike Rd SW Unit 10547455
- 2923 Hurst Rd SW
- 3117 Linsley Ct SW
- 3114 Linsley Ct SW Unit 4
- 3115 Linsley Ct SW Unit 4
- 3112 Linsley Ct SW
- 3113 Linsley Ct SW
- 829 Cambridge Creek Dr SW Unit 1
- 905 April Dr SW
- 828 Cambridge Creek Dr SW Unit 1
- 3110 Linsley Ct SW
- 3494 Heathervale Way SW
- 3109 Linsley Ct SW Unit 4
- 0 Linsley Ct SW Unit 7279361
- 3490 Heathervale Way SW
- 827 Cambridge Creek Dr SW Unit 1
- 3108 Linsley Ct SW Unit 2 Lower
- 3108 Linsley Ct SW Unit 1
- 3108 Linsley Ct SW
- 915 April Dr SW Unit 39
- 915 April Dr SW
- 3488 Heathervale Way SW Unit 4