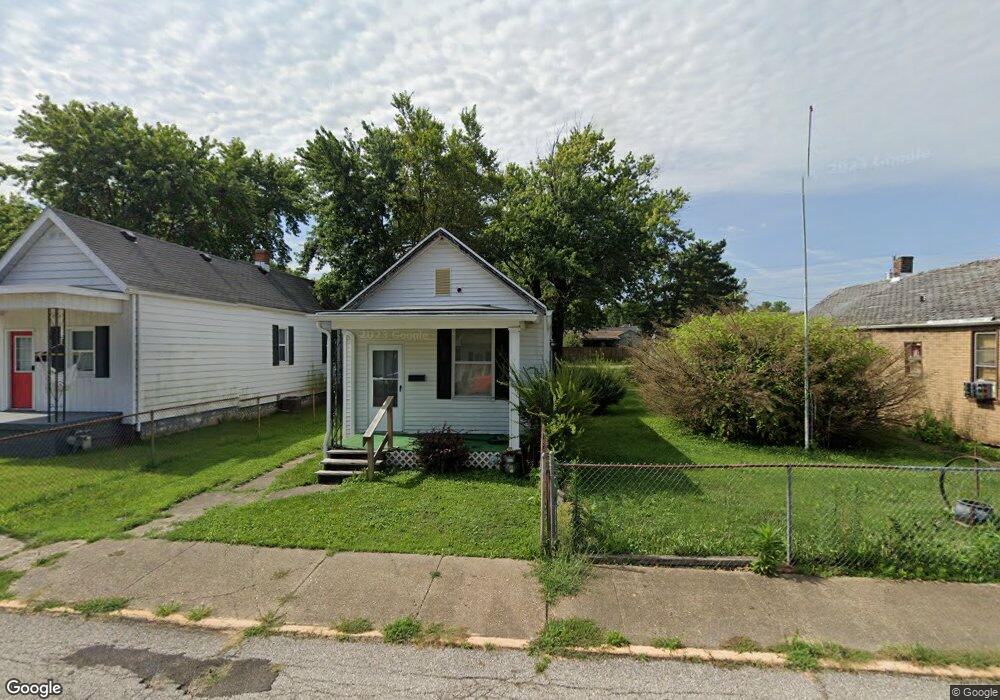
3116 Marion Ave Evansville, IN 47712
Poplar Grove NeighborhoodEstimated Value: $103,000 - $118,000
2
Beds
1
Bath
1,034
Sq Ft
$108/Sq Ft
Est. Value
About This Home
This home is located at 3116 Marion Ave, Evansville, IN 47712 and is currently estimated at $112,011, approximately $108 per square foot. 3116 Marion Ave is a home located in Vanderburgh County with nearby schools including Tekoppel Elementary School, Helfrich Park STEM Academy, and Francis Joseph Reitz High School.
Ownership History
Date
Name
Owned For
Owner Type
Purchase Details
Closed on
Oct 22, 2025
Sold by
5 Mile Properties Llc
Bought by
Edmund Carol C
Current Estimated Value
Purchase Details
Closed on
Dec 18, 2019
Sold by
Indyre Llc
Bought by
5 Mile Properties Llc
Purchase Details
Closed on
Dec 7, 2018
Sold by
County Of Vanderburgh
Bought by
Savvy In Llc
Purchase Details
Closed on
Mar 24, 2016
Sold by
Paradise Ventures Llc
Bought by
Masrani Global Llc
Purchase Details
Closed on
Nov 10, 2015
Sold by
Paradise Ventures Llc
Bought by
Paradise Ventures Llc
Purchase Details
Closed on
Jun 9, 2010
Sold by
Purviance Development Llc
Bought by
Vaughn William and Vaugh Julie
Purchase Details
Closed on
Jan 5, 2010
Sold by
Berger Patricia Marie
Bought by
Purviance Development Llc
Purchase Details
Closed on
Mar 3, 2006
Sold by
Alvers Cheryl A and Truelove Cheryl A
Bought by
Berger Patricia Marie
Create a Home Valuation Report for This Property
The Home Valuation Report is an in-depth analysis detailing your home's value as well as a comparison with similar homes in the area
Home Values in the Area
Average Home Value in this Area
Purchase History
| Date | Buyer | Sale Price | Title Company |
|---|---|---|---|
| Edmund Carol C | -- | Hometown Title | |
| 5 Mile Properties Llc | -- | None Available | |
| Savvy In Llc | $8,500 | None Available | |
| Masrani Global Llc | -- | -- | |
| Paradise Ventures Llc | $957 | -- | |
| Vaughn William | $40,000 | None Available | |
| Purviance Development Llc | -- | Direct Title Insurance Agenc | |
| Berger Patricia Marie | -- | None Available |
Source: Public Records
Mortgage History
| Date | Status | Borrower | Loan Amount |
|---|---|---|---|
| Closed | Vaughn William | $0 |
Source: Public Records
Tax History Compared to Growth
Tax History
| Year | Tax Paid | Tax Assessment Tax Assessment Total Assessment is a certain percentage of the fair market value that is determined by local assessors to be the total taxable value of land and additions on the property. | Land | Improvement |
|---|---|---|---|---|
| 2024 | $1,353 | $59,700 | $5,900 | $53,800 |
| 2023 | $1,251 | $57,600 | $5,700 | $51,900 |
| 2022 | $1,262 | $57,800 | $5,700 | $52,100 |
| 2021 | $1,187 | $53,400 | $5,700 | $47,700 |
| 2020 | $1,160 | $53,400 | $5,700 | $47,700 |
| 2019 | $1,153 | $53,400 | $5,700 | $47,700 |
| 2018 | $2,117 | $53,400 | $5,700 | $47,700 |
| 2017 | $1,149 | $52,700 | $5,700 | $47,000 |
| 2016 | $2,954 | $53,200 | $5,700 | $47,500 |
| 2014 | $431 | $51,900 | $5,700 | $46,200 |
| 2013 | -- | $47,800 | $5,700 | $42,100 |
Source: Public Records
Map
Nearby Homes
- 3301 Austin Ave
- 3008 Edgewood Dr
- 210 Leslie Ave
- 3416 Marion Ave
- 3011 Forest Ave
- 5 S Barker Ave
- 2721 Marion Ave
- 2908 W Indiana St
- 200 Rupper Ave
- 111 Wills Ave
- 3030 W Franklin St
- 3207 W Franklin St
- 2617 Edgewood Dr
- 2836 Dennison St
- 115 N Woods Ave
- 2806 W Franklin St
- 304 N Tekoppel Ave
- 2813 W Franklin St
- 3324 W Virginia St
- 2726 W Franklin St
- 3114 Marion Ave
- 3120 Marion Ave
- 3110 Marion Ave
- 3122 Marion Ave
- 3113 Hartmetz Ave
- 3128 Marion Ave
- 3104 Marion Ave
- 3115 Hartmetz Ave
- 3111 Hartmetz Ave
- 3109 Hartmetz Ave
- 3119 Hartmetz Ave
- 3119 Hartmetz Ave Unit 2
- 3119 Hartmetz Ave Unit 2 UNITS
- 3119 Marion Ave
- 3107 Hartmetz Ave
- 3113 Marion Ave
- 3100 Marion Ave
- 3111 Marion Ave
- 3123 Marion Ave
- 3123 Hartmetz Ave