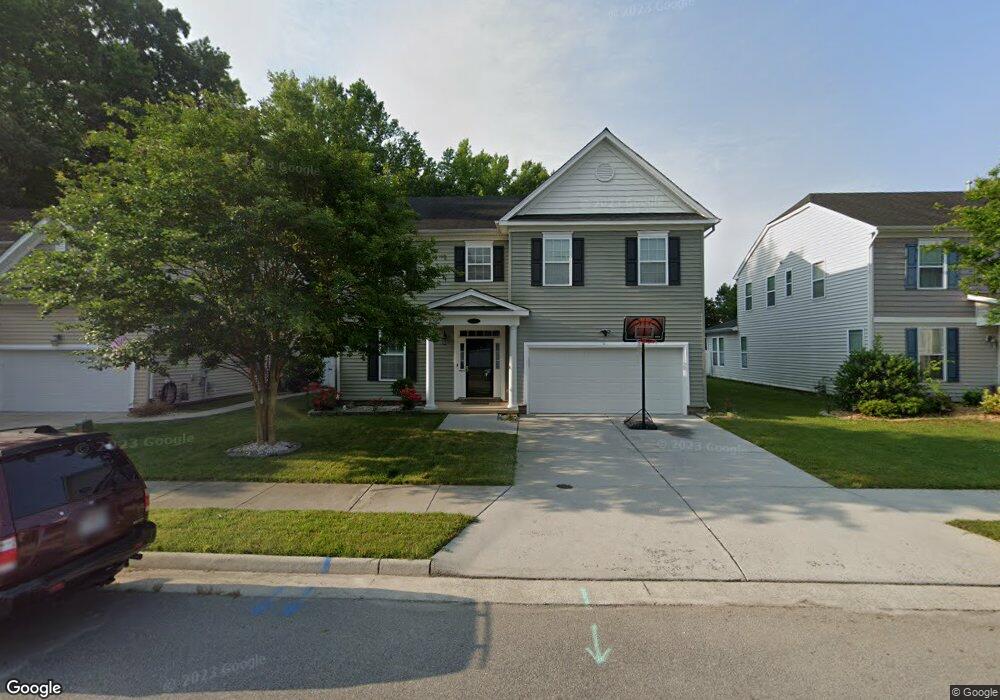
3116 Stone Creek Dr Suffolk, VA 23434
Cyprus NeighborhoodEstimated Value: $443,000 - $476,000
4
Beds
3
Baths
2,776
Sq Ft
$165/Sq Ft
Est. Value
About This Home
This home is located at 3116 Stone Creek Dr, Suffolk, VA 23434 and is currently estimated at $458,109, approximately $165 per square foot. 3116 Stone Creek Dr is a home located in Suffolk City with nearby schools including Mack Benn Jr. Elementary School, John F. Kennedy Middle School, and King's Fork High School.
Ownership History
Date
Name
Owned For
Owner Type
Purchase Details
Closed on
Oct 5, 2015
Sold by
The Secretary Of Veterans Affairs An Off
Bought by
Ofosuhene Samuel and Ofosuhene Henrietta
Current Estimated Value
Home Financials for this Owner
Home Financials are based on the most recent Mortgage that was taken out on this home.
Original Mortgage
$245,160
Outstanding Balance
$192,890
Interest Rate
3.88%
Mortgage Type
VA
Estimated Equity
$265,219
Purchase Details
Closed on
Mar 20, 2015
Sold by
Wells Fargo Bank Na
Bought by
Secretary Of Veterans Affairs
Purchase Details
Closed on
Dec 18, 2014
Sold by
Goden Kerwin and Goden Antonia
Bought by
Goden Kerwin
Purchase Details
Closed on
Oct 26, 2012
Sold by
Sandler At Graystone Llc
Bought by
Goden Kerwin S
Home Financials for this Owner
Home Financials are based on the most recent Mortgage that was taken out on this home.
Original Mortgage
$282,017
Interest Rate
3.56%
Mortgage Type
VA
Create a Home Valuation Report for This Property
The Home Valuation Report is an in-depth analysis detailing your home's value as well as a comparison with similar homes in the area
Home Values in the Area
Average Home Value in this Area
Purchase History
| Date | Buyer | Sale Price | Title Company |
|---|---|---|---|
| Ofosuhene Samuel | $240,000 | Attorney | |
| Secretary Of Veterans Affairs | $270,492 | -- | |
| Goden Kerwin | -- | -- | |
| Goden Kerwin S | $276,082 | -- |
Source: Public Records
Mortgage History
| Date | Status | Borrower | Loan Amount |
|---|---|---|---|
| Open | Ofosuhene Samuel | $245,160 | |
| Previous Owner | Goden Kerwin S | $282,017 |
Source: Public Records
Tax History Compared to Growth
Tax History
| Year | Tax Paid | Tax Assessment Tax Assessment Total Assessment is a certain percentage of the fair market value that is determined by local assessors to be the total taxable value of land and additions on the property. | Land | Improvement |
|---|---|---|---|---|
| 2024 | $450 | $415,800 | $80,000 | $335,800 |
| 2023 | $393 | $426,200 | $80,000 | $346,200 |
| 2022 | $4,127 | $378,600 | $80,000 | $298,600 |
| 2021 | $3,531 | $318,100 | $69,300 | $248,800 |
| 2020 | $3,312 | $298,400 | $69,300 | $229,100 |
| 2019 | $3,221 | $290,200 | $69,300 | $220,900 |
| 2018 | $1,486 | $290,300 | $69,300 | $221,000 |
| 2017 | $3,106 | $290,300 | $69,300 | $221,000 |
| 2016 | $3,018 | $282,100 | $69,300 | $212,800 |
| 2015 | $341 | $277,800 | $69,300 | $208,500 |
| 2014 | $341 | $277,800 | $69,300 | $208,500 |
Source: Public Records
Map
Nearby Homes
- 3109 Stonecreek Dr
- 311 Peachwood Ct
- 305 Ashwood Dr
- 7.95AC Prospect Rd
- 1324 Wilroy Rd
- 418 Williams Rd
- 105 Independence Ct
- 950 Portsmouth Blvd
- 1236 Willowbrook Dr
- 4062 Ravine Gap Dr
- 112 Independence Ct
- 168 Patriots Walke Dr
- 2702 E Washington St
- 2700 E Washington St
- 2704 E Washington St
- 104 Crocker St
- 2221 Florida Ave
- 1132 Proctor St
- 2208 Georgia Ave
- 113 Victory Place
- 3114 Stonecreek Dr
- 3118 Stone Creek Dr
- 3114 Stone Creek Dr
- 3118 Stonecreek Dr
- 3112 Stone Creek Dr
- 3112 Stonecreek Dr
- 3104 Stone Creek Dr
- 3200 Clearcreek Rd
- 3110 Stone Creek Dr
- 3202 Clearcreek Rd
- 3111 Stone Creek Dr
- 3111 Stonecreek Dr
- 3108 Stone Creek Dr
- 3109 Stone Creek Dr
- 3204 Clearcreek Rd
- 1107 Pin Oak Dr
- 1105 Pin Oak Dr
- 3107 Stone Creek Dr
- 3206 Clearcreek Rd
- 1109 Pin Oak Dr