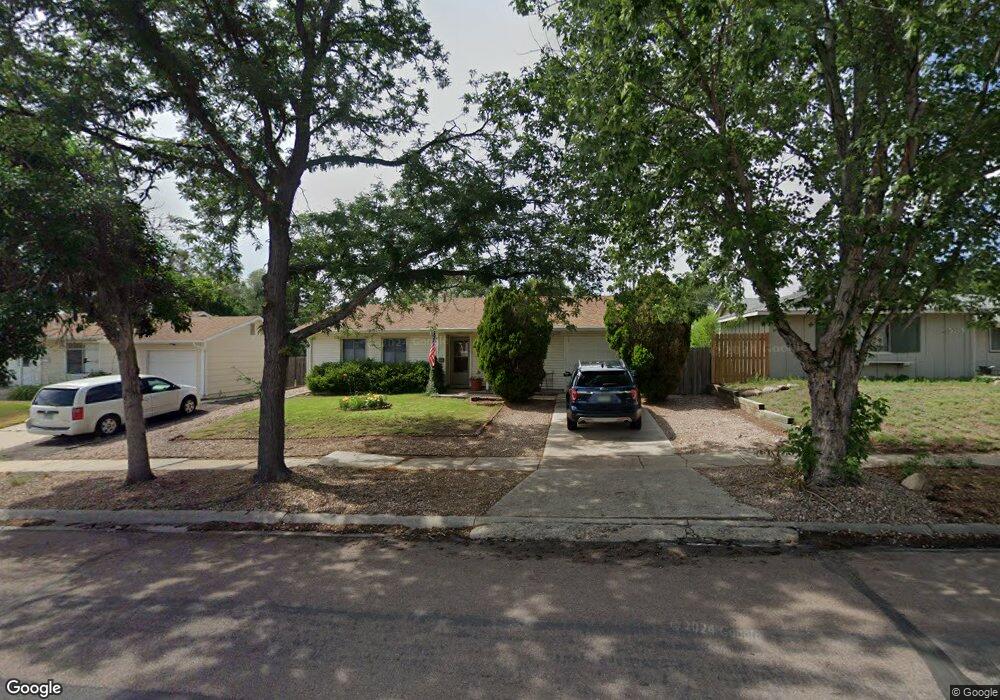
3117 Gomer Ave Colorado Springs, CO 80910
Park Hill NeighborhoodEstimated Value: $322,137 - $343,000
3
Beds
1
Bath
1,338
Sq Ft
$247/Sq Ft
Est. Value
About This Home
This home is located at 3117 Gomer Ave, Colorado Springs, CO 80910 and is currently estimated at $330,284, approximately $246 per square foot. 3117 Gomer Ave is a home located in El Paso County with nearby schools including Rogers Elementary School, Galileo School Of Math And Science, and Mitchell High School.
Ownership History
Date
Name
Owned For
Owner Type
Purchase Details
Closed on
Jun 4, 2001
Sold by
Daniels Brian and Daniels Kelly
Bought by
Yarbrough Connie D
Current Estimated Value
Home Financials for this Owner
Home Financials are based on the most recent Mortgage that was taken out on this home.
Original Mortgage
$117,653
Outstanding Balance
$44,685
Interest Rate
7.1%
Mortgage Type
FHA
Estimated Equity
$285,599
Purchase Details
Closed on
Jan 30, 1998
Sold by
Hodges Steven G and Hodges Melinda K
Bought by
Daniels Brian and Daniels Kelly
Home Financials for this Owner
Home Financials are based on the most recent Mortgage that was taken out on this home.
Original Mortgage
$93,637
Interest Rate
6.91%
Mortgage Type
FHA
Purchase Details
Closed on
Jul 19, 1993
Bought by
Yarbrough Connie D
Purchase Details
Closed on
Nov 2, 1988
Bought by
Yarbrough Connie D
Purchase Details
Closed on
Jul 1, 1983
Bought by
Yarbrough Connie D
Create a Home Valuation Report for This Property
The Home Valuation Report is an in-depth analysis detailing your home's value as well as a comparison with similar homes in the area
Home Values in the Area
Average Home Value in this Area
Purchase History
| Date | Buyer | Sale Price | Title Company |
|---|---|---|---|
| Yarbrough Connie D | $119,500 | First American | |
| Daniels Brian | $94,000 | Stewart Title | |
| Yarbrough Connie D | $64,900 | -- | |
| Yarbrough Connie D | -- | -- | |
| Yarbrough Connie D | -- | -- |
Source: Public Records
Mortgage History
| Date | Status | Borrower | Loan Amount |
|---|---|---|---|
| Open | Yarbrough Connie D | $117,653 | |
| Previous Owner | Daniels Brian | $93,637 |
Source: Public Records
Tax History Compared to Growth
Tax History
| Year | Tax Paid | Tax Assessment Tax Assessment Total Assessment is a certain percentage of the fair market value that is determined by local assessors to be the total taxable value of land and additions on the property. | Land | Improvement |
|---|---|---|---|---|
| 2025 | $1,081 | $23,750 | -- | -- |
| 2024 | $971 | $23,850 | $3,440 | $20,410 |
| 2022 | $916 | $16,370 | $3,130 | $13,240 |
| 2021 | $994 | $16,840 | $3,220 | $13,620 |
| 2020 | $871 | $12,830 | $2,500 | $10,330 |
| 2019 | $866 | $12,830 | $2,500 | $10,330 |
| 2018 | $719 | $9,800 | $1,800 | $8,000 |
| 2017 | $681 | $9,800 | $1,800 | $8,000 |
| 2016 | $563 | $9,710 | $1,830 | $7,880 |
| 2015 | $561 | $9,710 | $1,830 | $7,880 |
| 2014 | $543 | $9,030 | $1,830 | $7,200 |
Source: Public Records
Map
Nearby Homes
- 130 S Chelton Rd
- 2920 Hayman Terrace
- 2914 Hayman Terrace
- 2815 Gomer Ave
- 2815 Hayman Terrace
- 106 S Claremont St
- 18 S Roosevelt St
- 2906 Garland Terrace
- 3207 E Pikes Peak Ave
- 3231 Michigan Ave
- 3611 Dundee Place
- 12 Arrawanna St
- 37 S Chelton Rd
- 2624 Weir Ave
- 2902 Airport Rd Unit 204
- 2902 Airport Rd Unit 134
- 119 N Brentwood Dr
- 17 N Garland Ave
- 434 Valley hi Cir Unit B6
- 434 Valley hi Cir Unit B24
- 3113 Gomer Ave
- 3121 Gomer Ave
- 3110 Greenwood Cir
- 3109 Gomer Ave
- 3114 Greenwood Cir
- 3125 Gomer Ave
- 3118 Greenwood Cir
- 3114 Gomer Ave
- 3118 Gomer Ave
- 3103 Gomer Ave
- 3110 Gomer Ave
- 3129 Gomer Ave
- 3102 Greenwood Cir
- 3122 Greenwood Cir
- 126 S Brentwood Dr
- 3106 Gomer Ave
- 3126 Gomer Ave
- 130 S Brentwood Dr
- 3102 Gomer Ave
- 3202 Greenwood Cir