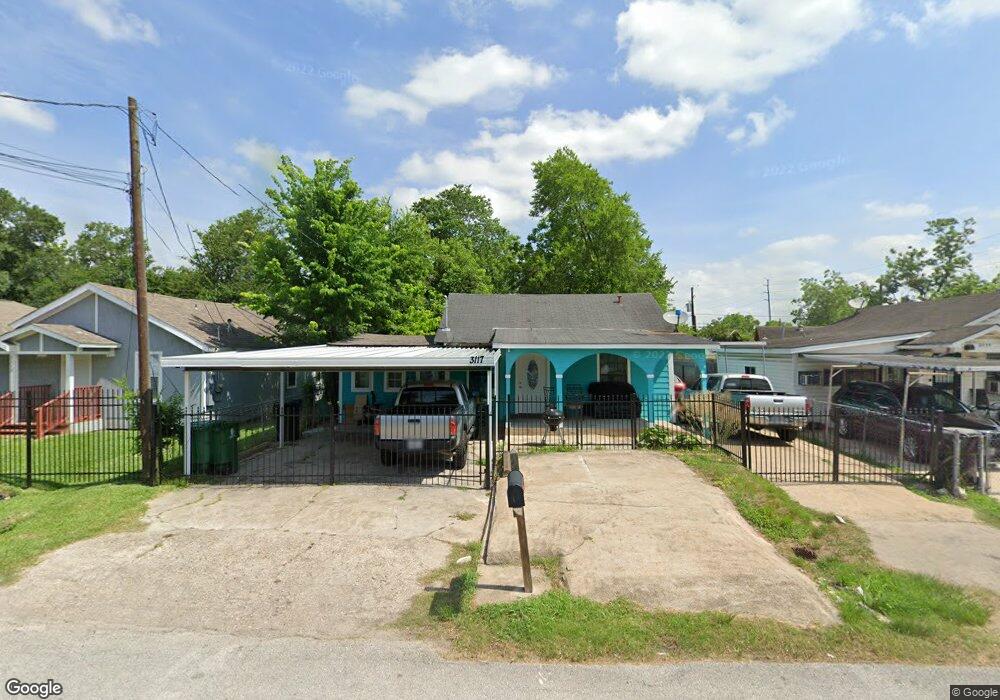
3117 Kay St Houston, TX 77093
Eastex-Jensen NeighborhoodEstimated Value: $113,542 - $297,000
4
Beds
2
Baths
2,054
Sq Ft
$105/Sq Ft
Est. Value
About This Home
This home is located at 3117 Kay St, Houston, TX 77093 and is currently estimated at $214,886, approximately $104 per square foot. 3117 Kay St is a home located in Harris County with nearby schools including Roderick R. Paige Elementary School, Key Middle, and Kashmere High School.
Ownership History
Date
Name
Owned For
Owner Type
Purchase Details
Closed on
Nov 1, 2022
Sold by
Reyes Alejandro Alberto
Bought by
Menorah Llc
Current Estimated Value
Purchase Details
Closed on
Jun 5, 2022
Sold by
Alberto Reyes Alejandro
Bought by
Menorah Llc
Purchase Details
Closed on
May 28, 2021
Sold by
R & R Properties
Bought by
Reyes Alejandro Alberto Canales and Aguilar Elsy C
Purchase Details
Closed on
Jun 2, 2018
Sold by
Herrera Nidia Isabel Delgado
Bought by
R & R Properties
Purchase Details
Closed on
May 12, 2016
Sold by
R R Properties
Bought by
Herrewra Nidia Isabel Delgado
Purchase Details
Closed on
May 5, 2016
Sold by
Durango Protfolio Inc
Bought by
R & R Properties
Purchase Details
Closed on
Mar 11, 2015
Sold by
Mosley Uradell Living and The Estate Of Francis Living T
Bought by
Durango Portfolio Inc
Purchase Details
Closed on
Feb 20, 2015
Sold by
Living Francis
Bought by
R & R Properties
Create a Home Valuation Report for This Property
The Home Valuation Report is an in-depth analysis detailing your home's value as well as a comparison with similar homes in the area
Home Values in the Area
Average Home Value in this Area
Purchase History
| Date | Buyer | Sale Price | Title Company |
|---|---|---|---|
| Menorah Llc | -- | -- | |
| Menorah Llc | -- | None Listed On Document | |
| Reyes Alejandro Alberto Canales | -- | None Available | |
| R & R Properties | -- | None Available | |
| Herrewra Nidia Isabel Delgado | -- | None Available | |
| R & R Properties | -- | None Available | |
| Durango Portfolio Inc | -- | None Available | |
| Mosely Uradell Living | -- | None Available | |
| R & R Properties | -- | None Available |
Source: Public Records
Tax History Compared to Growth
Tax History
| Year | Tax Paid | Tax Assessment Tax Assessment Total Assessment is a certain percentage of the fair market value that is determined by local assessors to be the total taxable value of land and additions on the property. | Land | Improvement |
|---|---|---|---|---|
| 2025 | $2,029 | $100,474 | $48,692 | $51,782 |
| 2024 | $2,029 | $96,988 | $48,692 | $48,296 |
| 2023 | $2,029 | $96,988 | $41,373 | $55,615 |
| 2022 | $1,615 | $73,333 | $27,051 | $46,282 |
| 2021 | $1,346 | $57,772 | $27,051 | $30,721 |
| 2020 | $1,277 | $52,724 | $27,051 | $25,673 |
| 2019 | $1,001 | $39,555 | $19,095 | $20,460 |
| 2018 | $947 | $37,438 | $19,095 | $18,343 |
| 2017 | $947 | $37,438 | $19,095 | $18,343 |
| 2016 | $947 | $37,438 | $19,095 | $18,343 |
| 2015 | $1,050 | $34,096 | $12,730 | $21,366 |
| 2014 | $1,050 | $40,827 | $12,730 | $28,097 |
Source: Public Records
Map
Nearby Homes
- 2821 E Crosstimbers St
- 7617 Jensen Dr
- 2940 Sadler St
- 7718 Duncan St
- 3529 Toliver St
- 2602 E Crosstimbers St
- 3008 Bostic St
- 7722 West St
- 3607 Penn St
- 2520 E Crosstimbers St
- 7305 Jensen
- 2624 Deams St
- 4006 Yorkshire St
- 4009 Yorkshire St
- 2516 Vaughn St
- 3210 Oklahoma St
- 7307 Adelbert St
- 2608 Bostic St
- 4114 E Toliver E Street St
- 2413 E Crosstimbers St