Estimated Value: $205,000 - $292,000
4
Beds
3
Baths
2,000
Sq Ft
$130/Sq Ft
Est. Value
About This Home
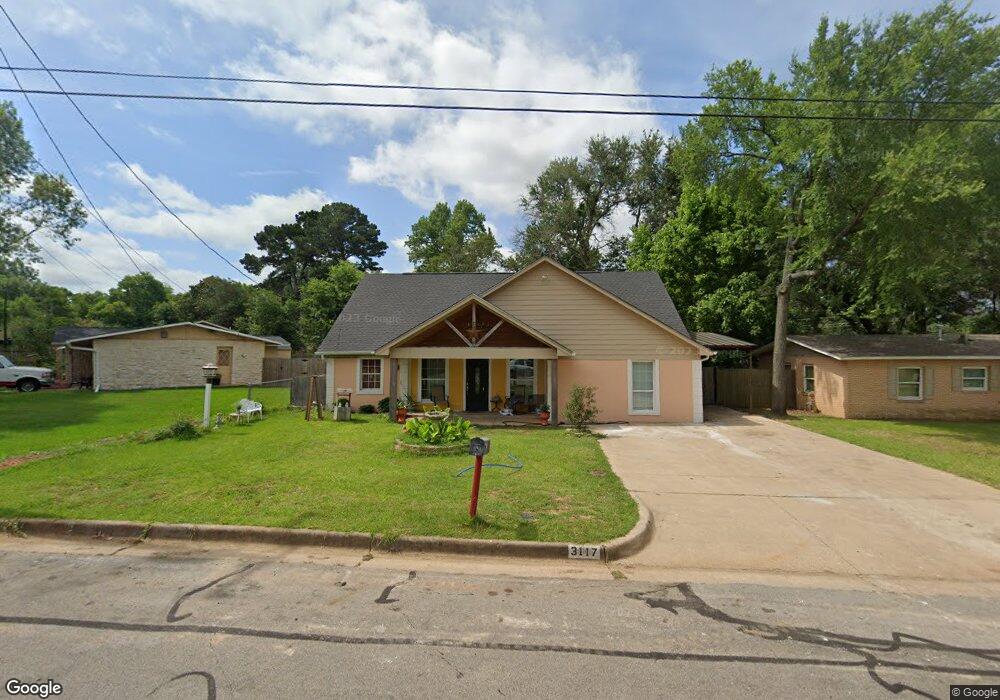
This home is located at 3117 Lamont St, Tyler, TX 75701 and is currently estimated at $259,630, approximately $129 per square foot. 3117 Lamont St is a home located in Smith County with nearby schools including Clarkston Elementary School, Hubbard Middle School, and Tyler Legacy High School.
Ownership History
Date
Name
Owned For
Owner Type
Purchase Details
Closed on
Jun 28, 2023
Sold by
Cuellar Carlos R and Cuellar Sonia Elizabeth
Bought by
Collins Haley and Collins Ricky
Current Estimated Value
Home Financials for this Owner
Home Financials are based on the most recent Mortgage that was taken out on this home.
Original Mortgage
$11,586
Interest Rate
6.39%
Mortgage Type
FHA
Purchase Details
Closed on
Mar 18, 2015
Sold by
Alvarado Jesus Tavira and Alvarado Leonor
Bought by
Cuellar Carlos R
Home Financials for this Owner
Home Financials are based on the most recent Mortgage that was taken out on this home.
Original Mortgage
$60,000
Interest Rate
3.6%
Mortgage Type
Purchase Money Mortgage
Purchase Details
Closed on
Dec 6, 2005
Sold by
Daniels Herbert L and Daniels Mildred D
Bought by
Alvarado Jesus and Alvarado Leonor
Home Financials for this Owner
Home Financials are based on the most recent Mortgage that was taken out on this home.
Original Mortgage
$17,800
Interest Rate
6.12%
Mortgage Type
Seller Take Back
Create a Home Valuation Report for This Property
The Home Valuation Report is an in-depth analysis detailing your home's value as well as a comparison with similar homes in the area
Home Values in the Area
Average Home Value in this Area
Purchase History
| Date | Buyer | Sale Price | Title Company |
|---|---|---|---|
| Collins Haley | -- | None Listed On Document | |
| Cuellar Carlos R | -- | None Available | |
| Alvarado Jesus | -- | None Available |
Source: Public Records
Mortgage History
| Date | Status | Borrower | Loan Amount |
|---|---|---|---|
| Closed | Collins Haley | $11,586 | |
| Open | Collins Haley | $289,656 | |
| Previous Owner | Cuellar Carlos R | $60,000 | |
| Previous Owner | Alvarado Jesus | $17,800 |
Source: Public Records
Tax History Compared to Growth
Tax History
| Year | Tax Paid | Tax Assessment Tax Assessment Total Assessment is a certain percentage of the fair market value that is determined by local assessors to be the total taxable value of land and additions on the property. | Land | Improvement |
|---|---|---|---|---|
| 2025 | $1,578 | $166,110 | $28,840 | $137,270 |
| 2024 | $1,578 | $148,324 | $9,024 | $139,300 |
| 2023 | $1,695 | $119,239 | $9,024 | $110,215 |
| 2022 | $1,732 | $100,920 | $9,024 | $91,896 |
| 2021 | $1,686 | $80,345 | $9,024 | $71,321 |
| 2020 | $1,680 | $78,533 | $9,024 | $69,509 |
| 2019 | $1,585 | $72,474 | $7,520 | $64,954 |
| 2018 | $1,495 | $68,745 | $7,520 | $61,225 |
| 2017 | $1,502 | $70,335 | $7,520 | $62,815 |
| 2016 | $1,528 | $71,563 | $7,520 | $64,043 |
| 2015 | $801 | $68,849 | $7,520 | $61,329 |
| 2014 | $801 | $66,759 | $7,520 | $59,239 |
Source: Public Records
Map
Nearby Homes
- 1835 Melba Dr
- 2033 Old Omen Rd
- 2931 Meadow Brook Trail
- 2019 Woodhaven Dr
- 2110 Crestwood Dr
- 3014 Brentwood Dr
- 2103 Crestwood Dr
- 3027 Brentwood Dr
- 2801 Valley View St
- 2216 Gish Ln
- 2936 Rollingwood Dr
- 3020 Meadowlark Ln
- 2713 Tanglewood Dr
- 3205 Timberlane Dr
- 2713 Brentwood Dr
- 2909 Meadowlark Ln
- 2523 Shenandoah Dr
- 3401 Omega Dr
- 1920 McDonald Rd
- 3108 Williamsburg Cir
- 3117 3117 Lamont
- 3111 Lamont St
- 1803 Melba Dr
- 1804 Old Omen Rd
- 1805 Melba Dr
- 1808 Old Omen Rd
- 3101 Lamont St
- 1812 Old Omen Rd
- 3114 Lamont St
- 1809 Melba Dr
- 3118 Lamont St
- 1900 Old Omen Rd
- 1804 Melba Dr
- 1814 Melba Dr
- 1811 Melba Dr
- 3057 Cornerstone Trail
- 1906 Old Omen Rd
- 1906 1906 Old Omen Rd
- 1808 Melba Dr
- 1833 Melba Dr