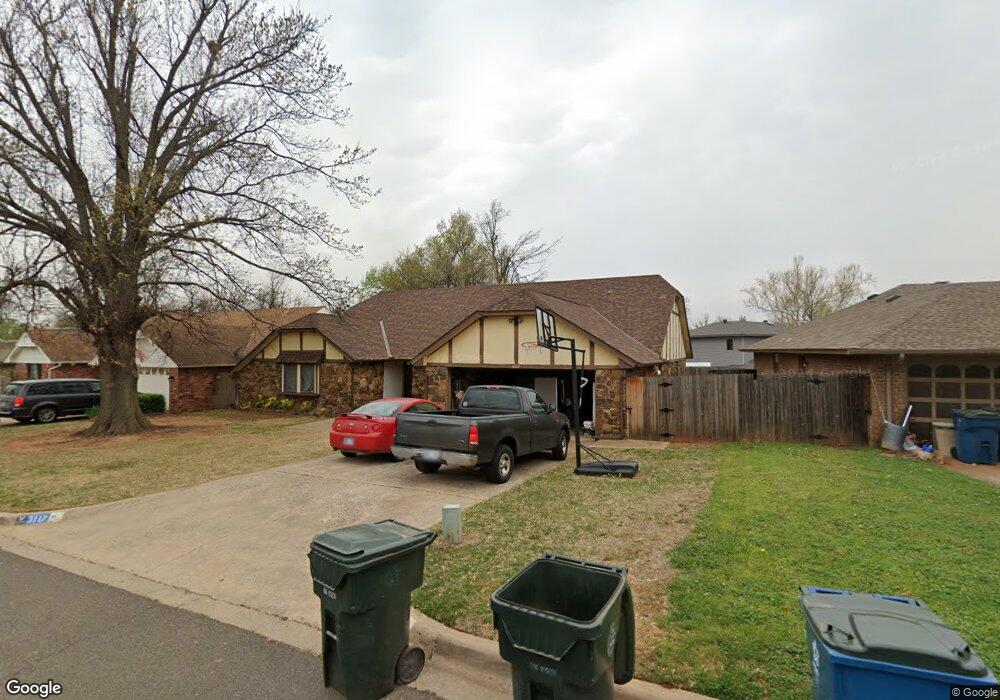
3117 Robin Rd Oklahoma City, OK 73110
Estimated Value: $259,000 - $268,000
4
Beds
2
Baths
2,360
Sq Ft
$112/Sq Ft
Est. Value
About This Home
This home is located at 3117 Robin Rd, Oklahoma City, OK 73110 and is currently estimated at $263,675, approximately $111 per square foot. 3117 Robin Rd is a home located in Oklahoma County with nearby schools including Ridgecrest Elementary School, Midwest City Middle School, and Midwest City High School.
Ownership History
Date
Name
Owned For
Owner Type
Purchase Details
Closed on
Aug 19, 2011
Sold by
Combs James B and Combs Cara
Bought by
Hicks Keith T and Hicks Beverly J
Current Estimated Value
Home Financials for this Owner
Home Financials are based on the most recent Mortgage that was taken out on this home.
Original Mortgage
$161,800
Outstanding Balance
$111,819
Interest Rate
4.53%
Mortgage Type
FHA
Estimated Equity
$151,856
Purchase Details
Closed on
Jul 26, 2007
Sold by
Summers John F and Summers Patricia M
Bought by
Combs James B
Home Financials for this Owner
Home Financials are based on the most recent Mortgage that was taken out on this home.
Original Mortgage
$163,440
Interest Rate
6.69%
Mortgage Type
VA
Purchase Details
Closed on
Nov 14, 1997
Sold by
Summers John F and Summers Patricia M
Bought by
Summers John F and Summers Patricia M
Purchase Details
Closed on
Aug 22, 1997
Sold by
Tomer Tina L
Bought by
Summers John F
Create a Home Valuation Report for This Property
The Home Valuation Report is an in-depth analysis detailing your home's value as well as a comparison with similar homes in the area
Home Values in the Area
Average Home Value in this Area
Purchase History
| Date | Buyer | Sale Price | Title Company |
|---|---|---|---|
| Hicks Keith T | $166,500 | Stewart Escrow & Title Midwe | |
| Combs James B | $160,000 | Stewart Escrow & Title Midwe | |
| Summers John F | -- | -- | |
| Summers John F | $107,000 | Stewart Escrow & Title |
Source: Public Records
Mortgage History
| Date | Status | Borrower | Loan Amount |
|---|---|---|---|
| Open | Hicks Keith T | $161,800 | |
| Previous Owner | Combs James B | $163,440 |
Source: Public Records
Tax History Compared to Growth
Tax History
| Year | Tax Paid | Tax Assessment Tax Assessment Total Assessment is a certain percentage of the fair market value that is determined by local assessors to be the total taxable value of land and additions on the property. | Land | Improvement |
|---|---|---|---|---|
| 2024 | $2,439 | $22,372 | $2,531 | $19,841 |
| 2023 | $2,439 | $21,721 | $2,532 | $19,189 |
| 2022 | $2,343 | $21,088 | $2,349 | $18,739 |
| 2021 | $2,326 | $20,474 | $2,682 | $17,792 |
| 2020 | $2,317 | $19,878 | $2,754 | $17,124 |
| 2019 | $2,150 | $19,299 | $2,761 | $16,538 |
| 2018 | $1,955 | $18,738 | $0 | $0 |
| 2017 | $1,925 | $18,191 | $2,768 | $15,423 |
| 2016 | $1,917 | $17,661 | $2,767 | $14,894 |
| 2015 | $1,935 | $17,147 | $2,904 | $14,243 |
| 2014 | $1,980 | $17,548 | $3,366 | $14,182 |
Source: Public Records
Map
Nearby Homes
- 212 W Ridgewood Dr
- 104 E Ridgewood Dr
- 3016 Shadybrook Dr
- 112 W Silver Meadow Dr
- 104 W Silver Meadow Dr
- 2921 Shadybrook Dr
- 2825 Woodcreek Rd
- 3321 N Ridgewood Dr
- 3307 Mockingbird Ln
- 3409 Shadybrook Dr
- 3413 Shadybrook Dr
- 3505 Woodvale Dr
- 125 Gill Dr
- 3605 Mount Pleasant Dr
- 216 Gill Dr
- 409 N Midwest Blvd
- 608 W Silver Meadow Dr
- 305 W Coe Dr
- 616 Fairlane Dr
- 617 W Silver Meadow Dr
- 3121 Robin Rd
- 3113 Robin Rd
- 108 W Ridgewood Dr
- 3125 Robin Rd
- 112 W Ridgewood Dr
- 3109 Robin Rd
- 3108 Robin Rd
- 3120 Robin Rd
- 3105 Robin Rd
- 102 Buckingham Place
- 3100 Robin Rd
- 103 Dove Hollow
- 3101 Robin Rd
- 100 W Ridgewood Dr
- 116 W Ridgewood Dr
- 105 Dove Hollow
- 3025 Robin Rd
- 3013 Bella Vista Dr
- 107 Dove Hollow
- 3009 Bella Vista Dr