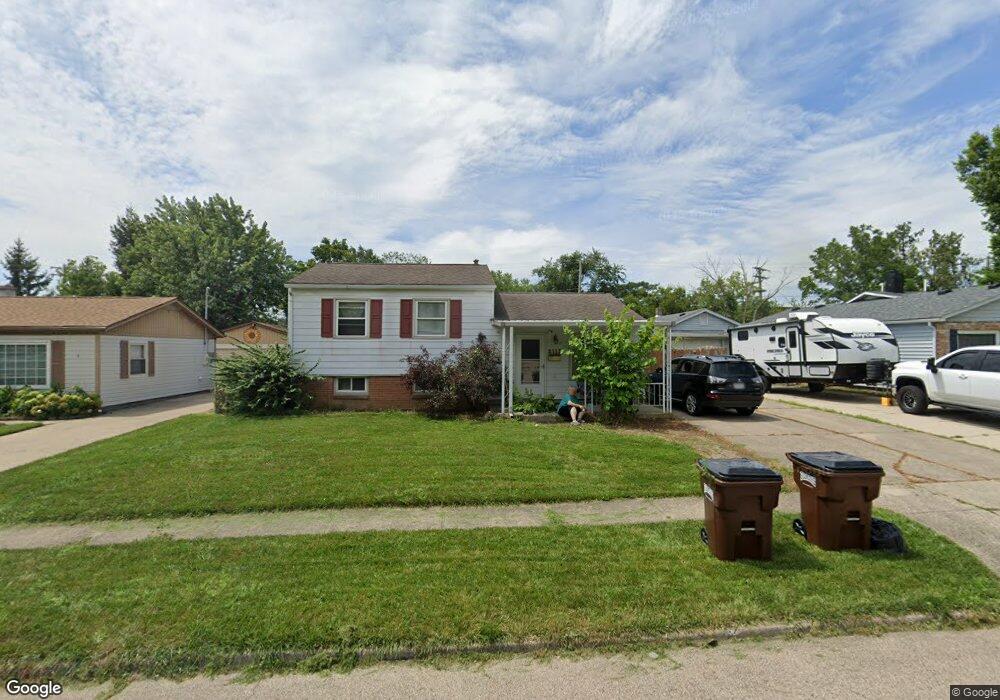
3117 Sudbury Dr Dayton, OH 45420
Estimated Value: $195,000 - $222,000
3
Beds
2
Baths
950
Sq Ft
$223/Sq Ft
Est. Value
About This Home
This home is located at 3117 Sudbury Dr, Dayton, OH 45420 and is currently estimated at $211,938, approximately $223 per square foot. 3117 Sudbury Dr is a home located in Montgomery County with nearby schools including Indian Riffle Elementary School, Kettering Middle School, and Kettering Fairmont High School.
Ownership History
Date
Name
Owned For
Owner Type
Purchase Details
Closed on
May 22, 2017
Sold by
Dix Tiffany M
Bought by
Engle Sheila R
Current Estimated Value
Purchase Details
Closed on
Sep 1, 2016
Sold by
U S Bank Na
Bought by
Dix Tiffany M
Purchase Details
Closed on
Jun 8, 2016
Sold by
Parrett Brian D
Bought by
U S Bank Na and Lehman Xs Trust Mortgage Pass Through
Purchase Details
Closed on
Jul 29, 1998
Sold by
Omer Dephew
Bought by
Parrett Brian D and Parrett Sheri L
Home Financials for this Owner
Home Financials are based on the most recent Mortgage that was taken out on this home.
Original Mortgage
$78,750
Interest Rate
7.02%
Mortgage Type
Purchase Money Mortgage
Purchase Details
Closed on
Aug 16, 1994
Sold by
Depew Omer
Bought by
Depew Omer
Create a Home Valuation Report for This Property
The Home Valuation Report is an in-depth analysis detailing your home's value as well as a comparison with similar homes in the area
Home Values in the Area
Average Home Value in this Area
Purchase History
| Date | Buyer | Sale Price | Title Company |
|---|---|---|---|
| Engle Sheila R | -- | None Available | |
| Dix Tiffany M | $62,299 | Premium Title Services Inc | |
| U S Bank Na | $68,000 | None Available | |
| Parrett Brian D | $65,200 | -- | |
| Parrett Brian D | $65,200 | -- | |
| Depew Omer | -- | -- |
Source: Public Records
Mortgage History
| Date | Status | Borrower | Loan Amount |
|---|---|---|---|
| Previous Owner | Parrett Brian D | $78,750 |
Source: Public Records
Tax History Compared to Growth
Tax History
| Year | Tax Paid | Tax Assessment Tax Assessment Total Assessment is a certain percentage of the fair market value that is determined by local assessors to be the total taxable value of land and additions on the property. | Land | Improvement |
|---|---|---|---|---|
| 2024 | $3,559 | $57,300 | $10,960 | $46,340 |
| 2023 | $3,559 | $57,300 | $10,960 | $46,340 |
| 2022 | $3,490 | $44,440 | $8,490 | $35,950 |
| 2021 | $3,228 | $44,440 | $8,490 | $35,950 |
| 2020 | $3,237 | $44,440 | $8,490 | $35,950 |
| 2019 | $2,963 | $35,940 | $8,490 | $27,450 |
| 2018 | $2,979 | $35,940 | $8,490 | $27,450 |
| 2017 | $2,744 | $35,940 | $8,490 | $27,450 |
| 2016 | $2,546 | $31,340 | $8,490 | $22,850 |
| 2015 | $2,432 | $31,340 | $8,490 | $22,850 |
| 2014 | $2,432 | $31,340 | $8,490 | $22,850 |
| 2012 | -- | $38,110 | $8,550 | $29,560 |
Source: Public Records
Map
Nearby Homes
- 3009 La Plata Dr
- 2301 Danube Ct
- 2432 Danube Ct
- 2512 Olson Dr
- 3428 Pobst Dr
- 2928 Prentice Dr
- 2843 Purdue Dr
- 2845 Nacoma Place
- 3116 Powhattan Place
- 2808 Whitehorse Ave
- 2954 Powhattan Place
- 3525 Valleywood Dr
- 2841 Chinook Ln
- 1801 Boesel Ave
- 1651 Beaverton Dr
- 2530 Barryknoll St
- 3241 Gracemore Ave
- 3201 Beaver Ave
- 1716 Willamet Rd
- 3736 Valleywood Dr
- 3113 Sudbury Dr
- 3121 Sudbury Dr
- 3109 Sudbury Dr
- 3125 Sudbury Dr
- 3124 Sudbury Dr
- 3105 Sudbury Dr
- 3129 Sudbury Dr
- 3112 Sudbury Dr
- 2408 Suffolk Ct
- 3101 Sudbury Dr
- 3133 Sudbury Dr
- 2401 Sheelah Ct
- 2409 Suffolk Ct
- 3100 Sudbury Dr
- 2409 Sheelah Ct
- 2416 Suffolk Ct
- 3041 Sudbury Dr
- 3137 Sudbury Dr
- 2415 Suffolk Ct
- 2408 Morningstar Ct