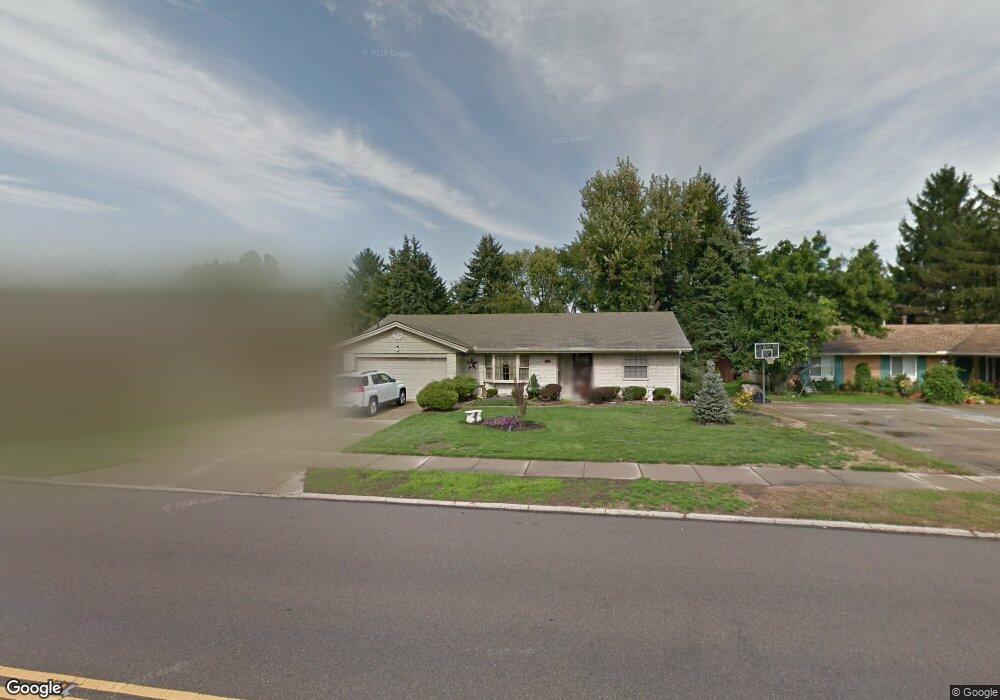
3117 Swigart Rd Beavercreek, OH 45440
Estimated Value: $275,783 - $314,000
3
Beds
2
Baths
1,683
Sq Ft
$178/Sq Ft
Est. Value
About This Home
This home is located at 3117 Swigart Rd, Beavercreek, OH 45440 and is currently estimated at $299,696, approximately $178 per square foot. 3117 Swigart Rd is a home located in Montgomery County with nearby schools including Prass Elementary School, Kettering Middle School, and Kettering Fairmont High School.
Ownership History
Date
Name
Owned For
Owner Type
Purchase Details
Closed on
Apr 21, 2025
Sold by
Martin Deloris F
Bought by
Deloris F Martin Revocable Living Trust and Martin
Current Estimated Value
Purchase Details
Closed on
Jul 31, 2009
Sold by
Young Marsha A
Bought by
Martin Earl C and Martin Deloris F
Home Financials for this Owner
Home Financials are based on the most recent Mortgage that was taken out on this home.
Original Mortgage
$148,117
Interest Rate
5.36%
Mortgage Type
VA
Purchase Details
Closed on
Oct 7, 2008
Sold by
Estate Of Danny L Young
Bought by
Young Marsha A
Purchase Details
Closed on
Jan 23, 2008
Sold by
Young Danny L and Young Marsha
Bought by
Young Danny L
Purchase Details
Closed on
Jul 30, 2004
Sold by
Ross Michael D and Ross Julie E
Bought by
Young Danny L and Young Marsha
Purchase Details
Closed on
Oct 19, 1993
Sold by
Ross Marvin M
Bought by
Ross Michael D and Ross Julie E
Create a Home Valuation Report for This Property
The Home Valuation Report is an in-depth analysis detailing your home's value as well as a comparison with similar homes in the area
Home Values in the Area
Average Home Value in this Area
Purchase History
| Date | Buyer | Sale Price | Title Company |
|---|---|---|---|
| Deloris F Martin Revocable Living Trust | -- | None Listed On Document | |
| Martin Earl C | $145,000 | Attorney | |
| Young Marsha A | -- | None Available | |
| Young Danny L | -- | Nations Title Agency Inc | |
| Young Danny L | $149,000 | -- | |
| Ross Michael D | -- | -- |
Source: Public Records
Mortgage History
| Date | Status | Borrower | Loan Amount |
|---|---|---|---|
| Previous Owner | Martin Earl C | $148,117 |
Source: Public Records
Tax History Compared to Growth
Tax History
| Year | Tax Paid | Tax Assessment Tax Assessment Total Assessment is a certain percentage of the fair market value that is determined by local assessors to be the total taxable value of land and additions on the property. | Land | Improvement |
|---|---|---|---|---|
| 2024 | $3,503 | $65,600 | $11,690 | $53,910 |
| 2023 | $3,503 | $65,600 | $11,690 | $53,910 |
| 2022 | $3,583 | $54,410 | $9,660 | $44,750 |
| 2021 | $3,314 | $54,410 | $9,660 | $44,750 |
| 2020 | $3,324 | $54,410 | $9,660 | $44,750 |
| 2019 | $3,158 | $47,100 | $9,660 | $37,440 |
| 2018 | $3,175 | $47,100 | $9,660 | $37,440 |
| 2017 | $2,924 | $47,100 | $9,660 | $37,440 |
| 2016 | $2,589 | $40,620 | $9,660 | $30,960 |
| 2015 | $2,473 | $40,620 | $9,660 | $30,960 |
| 2014 | $2,473 | $40,620 | $9,660 | $30,960 |
| 2012 | -- | $43,710 | $9,490 | $34,220 |
Source: Public Records
Map
Nearby Homes
- 3117 Swigert Rd
- 3034 Sandywood Dr
- 861 Acorn Dr
- 4901 Wilmington Pike
- 2648 Parklawn Dr
- 2816 Corlington Dr
- 2841 Corlington Dr
- 4824 Rean Meadow Dr
- 2579 Walford Dr
- 470 Cloverhill Ct
- 4533 Drayton Ct
- 4408 Glenheath Dr
- 2405 Westlawn Dr
- 4283 Ellason
- 4464 Woodner Dr
- 5052 Dobbs Dr
- 4282 Galway Ct
- 4275 Galway Ct
- 2447 Hemphill Rd
- 2409 Burning Tree Dr
- 3101 Swigart Rd
- 3133 Swigart Rd
- 3133 Swigert Rd
- 3066 Sandywood Dr
- 3065 Swigart Rd
- 3065 Swigert Rd
- 3149 Swigart Rd
- 3149 Swigert Rd
- 3058 Sandywood Dr
- 3050 Sandywood Dr
- 3132 Swigart Rd
- 3042 Sandywood Dr
- 3148 Swigart Rd
- 3049 Swigart Rd
- 3165 Swigart Rd
- 3165 Swigert Rd
- 3074 Sandywood Dr
- 3164 Swigart Rd
- 3191 Marigold Ct
- 3033 Swigart Rd