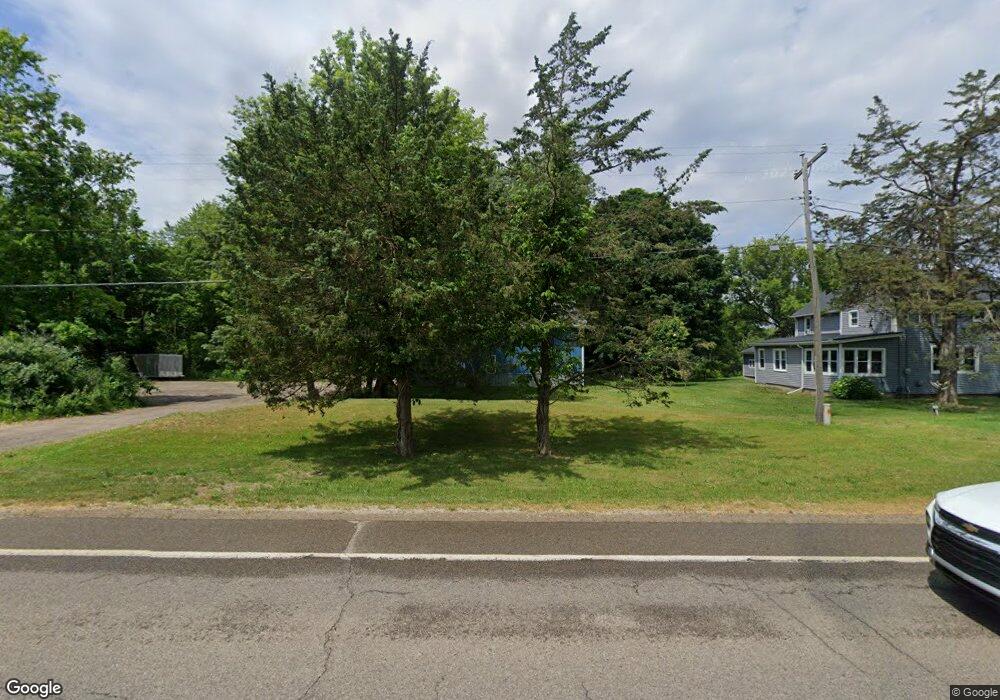
3118 10th St Wayland, MI 49348
Estimated Value: $293,000 - $413,000
4
Beds
3
Baths
2,025
Sq Ft
$166/Sq Ft
Est. Value
About This Home
This home is located at 3118 10th St, Wayland, MI 49348 and is currently estimated at $337,148, approximately $166 per square foot. 3118 10th St is a home located in Allegan County with nearby schools including Wayland High School and St. Therese Catholic School.
Ownership History
Date
Name
Owned For
Owner Type
Purchase Details
Closed on
Dec 3, 2018
Sold by
Vanmalsen Richard D
Bought by
Vanmalsen Richard D and Vanmalsen Angela M
Current Estimated Value
Home Financials for this Owner
Home Financials are based on the most recent Mortgage that was taken out on this home.
Original Mortgage
$152,000
Outstanding Balance
$84,646
Interest Rate
4.8%
Mortgage Type
New Conventional
Estimated Equity
$252,502
Purchase Details
Closed on
Jun 15, 2015
Sold by
Oosterheet Robb and Oosterheet Joy
Bought by
Vanmalsen Richard D
Purchase Details
Closed on
Jun 14, 2010
Sold by
Oosterheert Robb and Oosterheert Joy
Bought by
Vanmalson Richard D
Purchase Details
Closed on
Jun 4, 2009
Sold by
Rogers Roy and Rogers Sandra K
Bought by
Aurora Loan Services Llc
Purchase Details
Closed on
Oct 31, 2006
Sold by
Rogers Roy
Bought by
Rogers Roy and Rogers Sandra K
Home Financials for this Owner
Home Financials are based on the most recent Mortgage that was taken out on this home.
Original Mortgage
$118,000
Interest Rate
6.45%
Mortgage Type
Purchase Money Mortgage
Purchase Details
Closed on
Dec 7, 2005
Sold by
Transitional Living Services Llc
Bought by
United Bank Of Michigan
Purchase Details
Closed on
Oct 20, 2005
Sold by
Transitional Living Services Llc
Bought by
United Bank Of Michigan
Purchase Details
Closed on
Oct 23, 2001
Sold by
Gambee Nathan
Bought by
Transitional Living Services Llc
Home Financials for this Owner
Home Financials are based on the most recent Mortgage that was taken out on this home.
Original Mortgage
$102,781
Interest Rate
6.69%
Purchase Details
Closed on
Jan 20, 2001
Bought by
Gambee
Create a Home Valuation Report for This Property
The Home Valuation Report is an in-depth analysis detailing your home's value as well as a comparison with similar homes in the area
Home Values in the Area
Average Home Value in this Area
Purchase History
| Date | Buyer | Sale Price | Title Company |
|---|---|---|---|
| Vanmalsen Richard D | -- | Lighthouse Title Agency | |
| Vanmalsen Richard D | $99,900 | Chicago Title | |
| Vanmalson Richard D | -- | None Available | |
| Aurora Loan Services Llc | $41,580 | None Available | |
| Rogers Roy | -- | None Available | |
| Rogers Roy | $118,000 | None Available | |
| United Bank Of Michigan | -- | -- | |
| United Bank Of Michigan | $104,110 | -- | |
| Transitional Living Services Llc | -- | Chicago Title Of Michigan In | |
| Gambee Nathan | -- | Chicago Title Of Michigan In | |
| Gambee | -- | -- | |
| Gambee | -- | -- |
Source: Public Records
Mortgage History
| Date | Status | Borrower | Loan Amount |
|---|---|---|---|
| Open | Vanmalsen Richard D | $152,000 | |
| Previous Owner | Rogers Roy | $118,000 | |
| Previous Owner | Gambee Nathan | $102,781 |
Source: Public Records
Tax History Compared to Growth
Tax History
| Year | Tax Paid | Tax Assessment Tax Assessment Total Assessment is a certain percentage of the fair market value that is determined by local assessors to be the total taxable value of land and additions on the property. | Land | Improvement |
|---|---|---|---|---|
| 2025 | $2,116 | $141,500 | $29,600 | $111,900 |
| 2024 | $1,837 | $141,400 | $30,600 | $110,800 |
| 2023 | $1,886 | $108,300 | $29,100 | $79,200 |
| 2022 | $1,837 | $91,000 | $16,600 | $74,400 |
| 2021 | $1,744 | $85,500 | $16,600 | $68,900 |
| 2020 | $1,697 | $87,000 | $15,100 | $71,900 |
| 2019 | $1,663 | $70,700 | $15,100 | $55,600 |
| 2018 | $856 | $65,800 | $17,400 | $48,400 |
| 2017 | $0 | $67,200 | $17,400 | $49,800 |
| 2016 | $0 | $48,800 | $16,800 | $32,000 |
| 2015 | -- | $48,800 | $16,800 | $32,000 |
| 2014 | -- | $42,800 | $17,700 | $25,100 |
| 2013 | -- | $39,900 | $17,700 | $22,200 |
Source: Public Records
Map
Nearby Homes
- 986 129th Ave
- 3296 Stonehill Ct
- 3282 Stonehill Ct
- 3214 7th St
- 621 S Main St
- 330 Lotz Ct
- 835 Wild Flower Ct
- 110 E Sycamore St
- 146 Hanlon Ct
- 401 Anderson Dr
- 319 Alpine St
- 219 Alpine St
- 212 E Superior St
- 1130 128th Ave
- 1116 128th Ave
- 2841 Odawa Trail
- 2681 Geneva Lake Dr S
- 4674 12th St
- 1143 Regina Trail
- 1149 Regina Trail