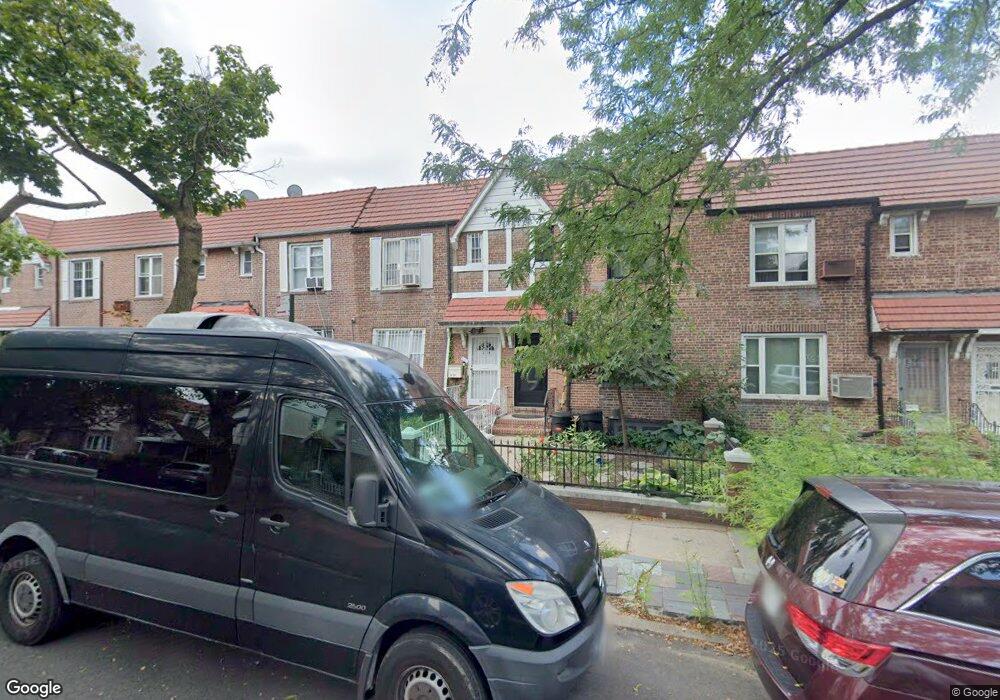
3118 77th St East Elmhurst, NY 11370
Jackson Heights NeighborhoodEstimated Value: $999,142 - $1,059,000
3
Beds
2
Baths
1,224
Sq Ft
$840/Sq Ft
Est. Value
About This Home
This home is located at 3118 77th St, East Elmhurst, NY 11370 and is currently estimated at $1,027,786, approximately $839 per square foot. 3118 77th St is a home located in Queens County with nearby schools including P.S. 212, I.S. 230, and William Cullen Bryant High School.
Ownership History
Date
Name
Owned For
Owner Type
Purchase Details
Closed on
Dec 30, 2014
Sold by
Fracchiolla Theresa R
Bought by
Commons Natalie Marie and Deb Debobroto
Current Estimated Value
Home Financials for this Owner
Home Financials are based on the most recent Mortgage that was taken out on this home.
Original Mortgage
$488,000
Outstanding Balance
$375,435
Interest Rate
3.96%
Mortgage Type
New Conventional
Estimated Equity
$652,351
Create a Home Valuation Report for This Property
The Home Valuation Report is an in-depth analysis detailing your home's value as well as a comparison with similar homes in the area
Home Values in the Area
Average Home Value in this Area
Purchase History
| Date | Buyer | Sale Price | Title Company |
|---|---|---|---|
| Commons Natalie Marie | $610,000 | -- |
Source: Public Records
Mortgage History
| Date | Status | Borrower | Loan Amount |
|---|---|---|---|
| Open | Commons Natalie Marie | $488,000 |
Source: Public Records
Tax History Compared to Growth
Tax History
| Year | Tax Paid | Tax Assessment Tax Assessment Total Assessment is a certain percentage of the fair market value that is determined by local assessors to be the total taxable value of land and additions on the property. | Land | Improvement |
|---|---|---|---|---|
| 2025 | $8,276 | $43,675 | $7,028 | $36,647 |
| 2024 | $6,596 | $41,206 | $7,379 | $33,827 |
| 2023 | $7,916 | $39,413 | $6,225 | $33,188 |
| 2022 | $7,810 | $49,500 | $9,240 | $40,260 |
| 2021 | $8,119 | $50,340 | $9,240 | $41,100 |
| 2020 | $7,408 | $43,500 | $9,240 | $34,260 |
| 2019 | $6,885 | $40,860 | $9,240 | $31,620 |
| 2018 | $6,398 | $32,844 | $7,915 | $24,929 |
| 2017 | $6,339 | $32,602 | $7,619 | $24,983 |
| 2016 | $5,806 | $32,602 | $7,619 | $24,983 |
| 2015 | $3,271 | $30,330 | $9,051 | $21,279 |
| 2014 | $3,271 | $28,615 | $8,801 | $19,814 |
Source: Public Records
Map
Nearby Homes